
Fancy a retailer with 1400 stores?
Published 01-FEB-2019 12:33 P.M.
|
8 minute read
Hey! Looks like you have stumbled on the section of our website where we have archived articles from our old business model.
In 2019 the original founding team returned to run Next Investors, we changed our business model to only write about stocks we carefully research and are invested in for the long term.
The below articles were written under our previous business model. We have kept these articles online here for your reference.
Our new mission is to build a high performing ASX micro cap investment portfolio and share our research, analysis and investment strategy with our readers.
Click Here to View Latest Articles
Finfeed’s stock of the week is a fashion retailer — but before examining the company, we feel it is important to provide details on industry dynamics, particularly in light of the misinformation and poorly contextualised data being fed to investors.
This stock is a bricks and mortar retailer, a constituent of one of the most maligned industry segments on the ASX, with many market commentators/speculators suggesting the time is nigh when e-commerce will dispense with the need for a shopfront presence.
It is important to note that bricks and mortar companies are for the best part a ‘sub-segment’ of the S&P/ASX 200 Consumer Discretionary index.
When you compare share price performances, it is obvious that they pretty much get the broadbrush treatment as a flagging sub-sector trying to tread water, even when consumer spending data is positive.
Big numbers need to be put into context
Driving this trend has been big numbers bandied around by e-commerce bulls — unfortunately, very rarely are they taken to task in terms of contextualising those big numbers.
E-commerce has grown from virtually nothing a decade ago, so ample growth should have been expected.
What tended to be lost in all the hype, however, was the proportion of e-commerce spending to total spending across various sectors.
Examining sub-sector performances is extremely important as industries have been, and will continue to be, impacted in very different ways by online buying.
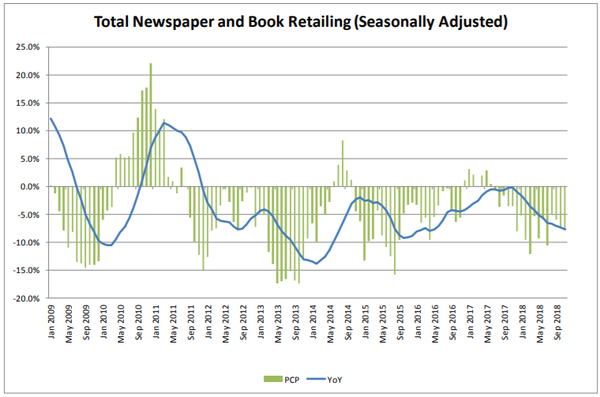
The charts below (Australian Bureau of Statistics data) demonstrate two sub-sectors that, by their very nature, would be expected to lend themselves to, or as the second chart shows, be only nominally impacted by, online buying.
The first chart demonstrates the substantial negative impact on the likes of bricks and mortar bookshops and newsagents over the last 10 years, following the mass transition to accessing everything from day-to-day news to novels and research papers via the internet.
Whether it’s reading the Washington Post on the way to work or kicking back with a novel at home, it can be easily done online, and in the case of books, products such as Kindle have really taken off.
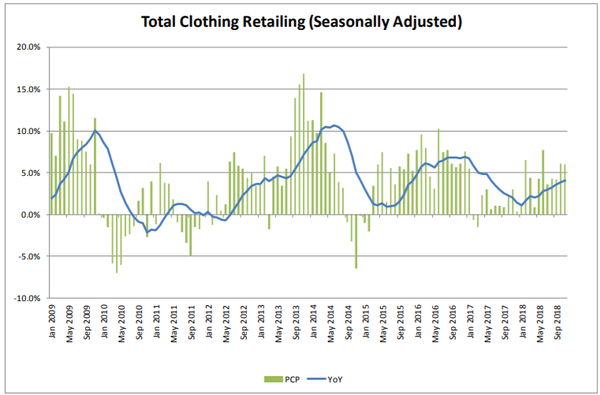
By comparison, clothing goods are more of a 'try before you buy' scenario, and while there is evidence that some shoppers try on in-store and buy online, once again this accounts for a small proportion of sales.
Furthermore, most of the larger retailers now have well-established omni-channel sales platforms where shoppers can buy directly off-line, buy in-store, or secure the item for purchase in-store and have it delivered.
Setting that aside, though, the following chart clearly shows the yawning gap between the two sectors, as well as demonstrating the long-term resilience of the fashion sector.
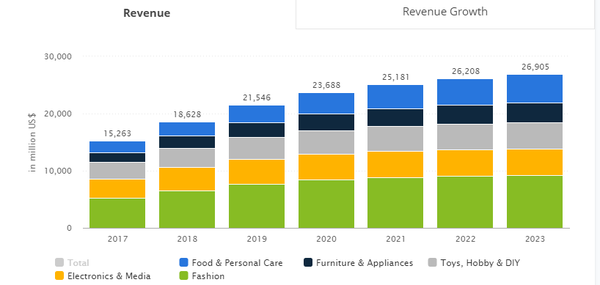
The next chart below shows revenue generated from e-commerce sales since 2017, and makes projections out to 2023.
Fashion is featured in green, and it indicates that there will be reasonable growth in e-commerce spending out to 2020, with a definite downturn in the levels of growth after 2020.
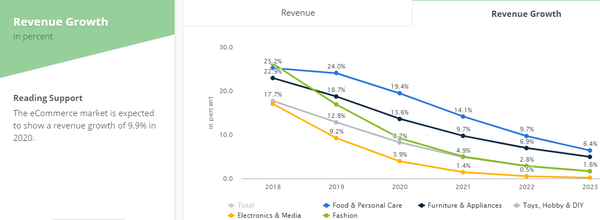
The extent of the slowing in year-on-year growth can be seen in the next chart, which indicates that fashion will experience a more substantial decline between 2018 and 2023 than any of the other sectors featured.
The following two charts show that there is a decided flattening in user numbers over the next five years, with the second chart indicating that a shift to big ticket items in coming years isn’t expected.
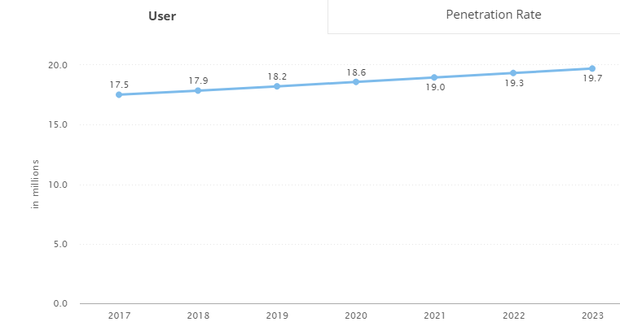
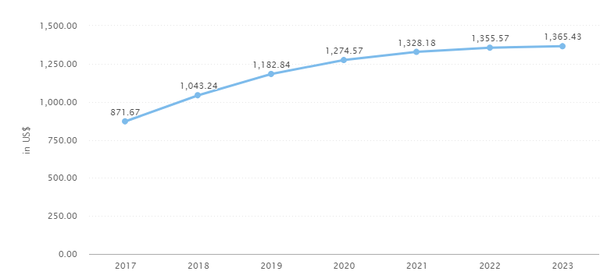
Note that the average revenue per unit spend only increases from approximately US$1274 in 2020 to US$1365 in 2023.
Deduct the normal inflationary impact on prices which would have a positive impact on revenue per unit spent, and you will see a trend supporting the theory that the decision to use e-commerce is likely to be negatively influenced by the price of the item.
In short, if a consumer is paying big money for a piece of jewellery, a car, or a bathroom renovation for that matter, they will normally want to touch, feel or test drive what they are buying.
The same can be said for fashion apparel, where consumers want to make sure the item fits and suits them, while also having the opportunity to compare products that are only steps away, rather than having to navigate a website to find an often unclear product image.
On that note, Finfeed introduces its stock of the week, Noni B Ltd (ASX:NBL) — a women’s fashion retailer that following recent acquisitions, will generate nearly $1 billion in revenue per year from more than 1400 stores across Australia and New Zealand, making it Australia’s largest specialty retail group.
Noni lays the cards on the table
With reporting season upon, us it is worthwhile targeting stocks that have provided recent guidance.
All too often, companies report results below the expectations of investors and/or brokers resulting in substantial share price declines.
There are also circumstances where companies deliver on half yearly expectations, but provide full-year guidance below expectations — another factor that usually sends share prices tumbling.
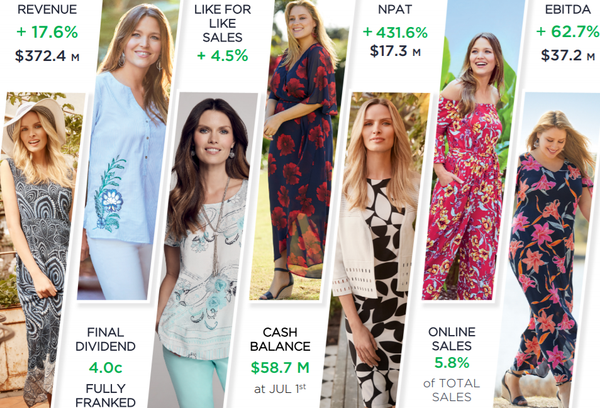
Noni B has addressed these areas, releasing a statement on January 10 which provided valuable information on its first half trading performance, earnings guidance, broader industry conditions, as well as reaffirming full year EBITDA expectations of approximately $45 million.
Regarding full year guidance, analysts at Morgans reaffirmed their full-year EBITDA projections as recently as Wednesday.
The broker is forecasting earnings of $45.3 million, supporting its ‘add’ recommendation and price target of $4.02.
Putting the pedal to the metal in 2020
However, the real earnings kick is forecast to occur in fiscal 2020, when the company benefits from acquisitions made in 2018.
With integration expenses and cost outs to be realised in 2018, Morgans is forecasting EBITDA to increase 74% to $78.9 million in 2020.
This represents earnings per share of 38.6 cents, implying a PE multiple of seven relative to the company’s current share price.
The broker is forecasting a full year dividend of 23.1 cents in fiscal 2020, representing a yield of 8.5%.
Morgans also noted that the recent launch of a share buy-back program enhanced the compelling value metrics implied by its earnings multiples and dividend yield.
Net cash of $43 million after $31 million acquisition
The buy-back program is not only a statement by management that it sees value in its shares at the current price, but it also decreases the number of shares on issue, effectively increasing earnings per share relative to net profit.
Noni B’s balance sheet was in good shape at the end of calendar year 2018 with cash holdings of $65 million, compared with $34 million in December 2017.
This leaves the company with net cash of approximately $43 million — an outstanding achievement, having completed the $31 million acquisition of five well-known brands from Specialty Fashion Group less than six months prior.
On the score of fundamentals, analysts at Wilsons are forecasting similar earnings, supporting their 'buy' recommendation and price target of $4.66 — substantially higher than Morgans’.
Noni, you’ve done it again
Noni isn’t new to acquisitions — a factor that should work in its favour, given the number of companies that fail to effectively integrate new businesses, leading to earnings deterioration despite topline growth.
In fiscal 2017, the company acquired three additional brands through the purchase of Pretty Girl Fashion Group, completed their integration, and, most importantly, reported a 324.9% increase in underlying pre-tax profit.
The acquisition transitioned Noni B from a one-brand clothing store to a more diversified four-brand enterprise, while also increasing the number of stores from about 200 to more than 600.
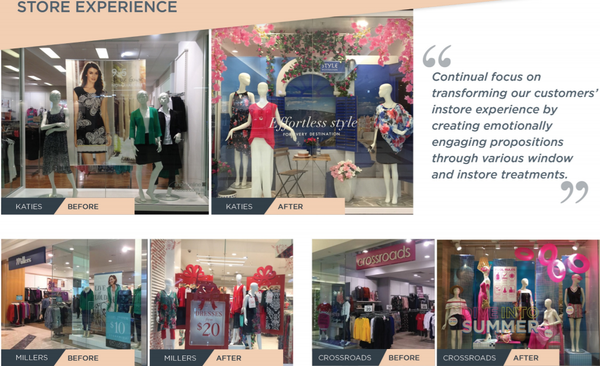
The acquisition of Specialty Fashion Group’s brands has been equally transformative, increasing the company’s store numbers to more than 1400, while adding household names such as Millers, Katies, Crossroads, Autograph and Rivers to its portfolio of brands.
Like-for-like sales growth is an important measure of sales performance as it strips out the impact of revenue growth that has been achieved as a function of acquisitions and/or store expansion.
This came in at 4.5% in fiscal 2018, and revenue growth was complemented by a 10 month contribution from Pretty Girl stores.
Perhaps a guide to what lies ahead in the integration of five new labels, the Pretty Girl brands — Rockmans, W.Lane and beme — improved substantially after joining Noni.
In terms of transforming the previously loss-making Specialty Fashion Group brands, there will obviously be challenges, but management’s commentary on performance measurement was encouraging, with chairman Richard Facioni saying: “In addition to significant cost synergies and margin improvement generated by the acquisition of the Specialty Brands, a major opportunity for the group going forward is to adopt a strategy to manage gross profit across the portfolio of brands to deliver long term sustainable earnings growth.
“As a result, like-for-like gross profit growth will become a core focus and, where appropriate, will be prioritised over like-for-like sales growth as the group focuses on higher-margin sales.
Managing director Scott Evans made reference to these indicators when providing guidance in January, saying: “The group remains confident for the second half of the financial year as it continues its strategy to deliver synergies and improve gross profit sustainably across the portfolio of brands.”
General Information Only
S3 Consortium Pty Ltd (S3, ‘we’, ‘us’, ‘our’) (CAR No. 433913) is a corporate authorised representative of LeMessurier Securities Pty Ltd (AFSL No. 296877). The information contained in this article is general information and is for informational purposes only. Any advice is general advice only. Any advice contained in this article does not constitute personal advice and S3 has not taken into consideration your personal objectives, financial situation or needs. Please seek your own independent professional advice before making any financial investment decision. Those persons acting upon information contained in this article do so entirely at their own risk.
Conflicts of Interest Notice
S3 and its associated entities may hold investments in companies featured in its articles, including through being paid in the securities of the companies we provide commentary on. We disclose the securities held in relation to a particular company that we provide commentary on. Refer to our Disclosure Policy for information on our self-imposed trading blackouts, hold conditions and de-risking (sell conditions) which seek to mitigate against any potential conflicts of interest.
Publication Notice and Disclaimer
The information contained in this article is current as at the publication date. At the time of publishing, the information contained in this article is based on sources which are available in the public domain that we consider to be reliable, and our own analysis of those sources. The views of the author may not reflect the views of the AFSL holder. Any decision by you to purchase securities in the companies featured in this article should be done so after you have sought your own independent professional advice regarding this information and made your own inquiries as to the validity of any information in this article.
Any forward-looking statements contained in this article are not guarantees or predictions of future performance, and involve known and unknown risks, uncertainties and other factors, many of which are beyond our control, and which may cause actual results or performance of companies featured to differ materially from those expressed in the statements contained in this article. S3 cannot and does not give any assurance that the results or performance expressed or implied by any forward-looking statements contained in this article will actually occur and readers are cautioned not to put undue reliance on forward-looking statements.
This article may include references to our past investing performance. Past performance is not a reliable indicator of our future investing performance.