Can’t see the wood for the trees? Try Cedar Woods
Published 16-NOV-2018 12:35 P.M.
|
7 minute read
Hey! Looks like you have stumbled on the section of our website where we have archived articles from our old business model.
In 2019 the original founding team returned to run Next Investors, we changed our business model to only write about stocks we carefully research and are invested in for the long term.
The below articles were written under our previous business model. We have kept these articles online here for your reference.
Our new mission is to build a high performing ASX micro cap investment portfolio and share our research, analysis and investment strategy with our readers.
Click Here to View Latest Articles
Finfeed’s stock of the week is Cedar Woods Properties (ASX:CWP), a leading property developer that has recently experienced some share price weakness, which appears unwarranted.
In fact, by all measures, including forward PE multiples, dividend yields, discount to consensus price targets, earnings visibility and management’s upbeat guidance, Cedar Woods looks to be decidedly undervalued.
While the old saying, ‘If it sounds too good to be true, it probably is,’ is usually spot-on, in the case of CWP, there are clear reasons why there has been recent share price weakness, and it has nothing to do with the company’s operational performance or its future prospects.
So, in essence, our stock of the week isn’t the flavour of the month, but it may well offer best in class returns in fiscal 2019.

All the metrics add up
Before we get into the operational aspects of the company, let’s run through the vital statistics.
Consensus forecasts indicate Cedar Woods will generate earnings per share of 67.2 cents in fiscal 2019, representing year-on-year growth of 25.1%.
The consensus fiscal 2019 dividend estimate is 33.9 cents, although analysts at Morgans are forecasting 35 cents.
The consensus dividend implies a grossed up dividend yield of just over 9% relative to Wednesday’s closing price of $5.37.
Because Cedar Woods pays a fully franked dividend, unlike most real estate investment trusts (REITs), the grossed up dividend yield gives it a distinct advantage with significant tax benefits, depending on the shareholder’s financial circumstances.
It is also worth noting that Cedar Woods’ grossed up dividend yield is superior to all ASX-listed REITs that currently have publicly available consensus forecasts.
The company is currently trading on a fiscal 2019 PE multiple of eight — well below the industry group average of 14.7.
The company also stacks up well on a price-earnings to growth (PEG) basis with consensus fiscal 2019 and 2020 forecasts implying compound annual earnings per share growth of 18.6% over the coming two years.
Cedar Woods has a strong balance sheet with its gearing in the vicinity of 30%, the lower end of management’s target range of between 20% and 75%.
Finally, the consensus 12 month share price target of $6.89 implies upside of approximately 27% to the company’s current share price.
While management didn’t provide quantitative earnings guidance for 2019 when delivering its fiscal 2018 result, it did flag a number of factors that were expected to work in its favour in the coming 12 months that provide confidence in predicting a “strong uplift in profit”.
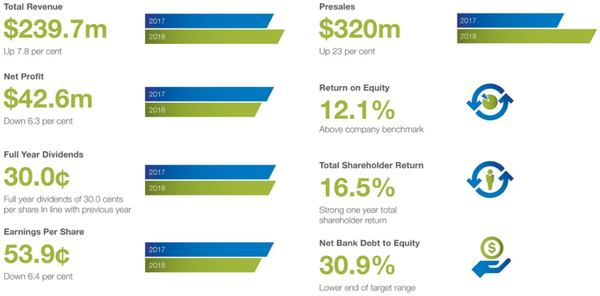
These are the financial foundations that were laid in fiscal 2018:
The share price weakness question
So, the obvious question is this — why did the share price slump from about $6.20 in the last week of September to a low of $5.13 towards the end of October?
There are a few reasons behind the fall, some of which are clear-cut and tangible and therefore easy to understand, while others are more shades of grey and sentiment-driven issues.
The easiest to explain is the fall from $6.09 to $5.82 on September 26.
This was the day that Cedar Woods went ex-dividend, leaving the company prone to the frequent practice of dividend stripping. This refers to shareholders who sell the stock immediately after they become entitled to the dividend, effectively creating high-volume selling which drives the share price lower.
In some cases, the related fall in the share price exceeds the amount of the dividend, and in Cedar Woods’ case, the fall of 27 cents was well in excess of the dividend of 18 cents.
Because dividend stripping isn’t widely understood and investors are often out of touch with the timing of ex-dividend dates, the sharp fall can trigger a second wave of selling as shareholders surmise there is something amiss.
October drags all stocks lower
This possibly accounts for selling through to early October that saw the company trade as low as $5.51.
The further fall of 10% which occurred as October unfolded could be attributed to the broader sell-off in global equities markets.
During this period, the S&P/ASX All Ordinaries index (XAO) also fell nearly 10%.
It is also worth noting that over the last two months, the S&P/ASX 200 A-REIT index, which includes REITs and property developers, has fallen approximately 10% — perhaps reflecting the impact of dividend stripping on other stocks in the sector.
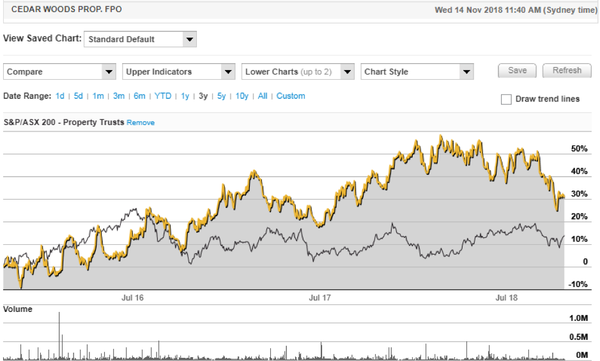
At this point, it is relevant to assess Cedar Woods’ (yellow line) longer-term performance against the index as it demonstrates for the best part the parallels that can be drawn between the sector trends and the stock itself, including the impact of the recent downturn.
A decade-long record of outperformance
One of the most interesting factors to take into account with the chart above is the relative outperformance of Cedar Woods for most of the three-year period, with a particularly wide gap having developed between about December 2017 and September 2018.
You can then see Cedar Woods’ slightly larger bounce in the last couple of days relative to the sector uptick, which may indicate that the historical degree of outperformance compared with the sector could be restored.
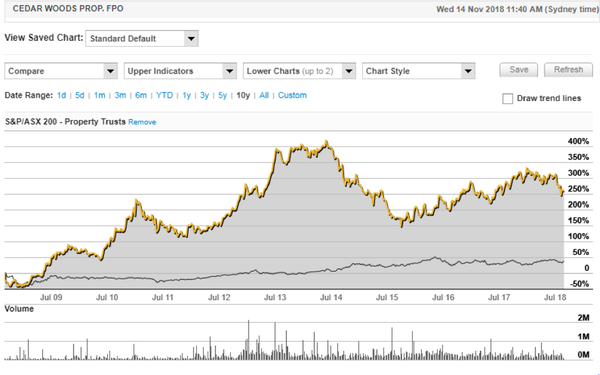
From an overall perspective, the charts definitely demonstrate that the company (yellow line) has established a long history of outperforming its peers, and this is particularly evident in the following 10 year chart:
Earnings visibility provides assurance
At a time when some commentators in the property sector are predicting a downturn in house prices, it should be remembered that any fall will represent a retracement from particularly high levels.
Underlining the significance of this aspect of the equation is the fact that markets such as New South Wales and Victoria have shown weakness in various data that has been released in recent months.
Importantly, Cedar Woods is not exposed to the NSW market.
It is also worth noting that the property market isn’t a one-size-fits-all environment, as the company’s performance in Victoria has been very strong.
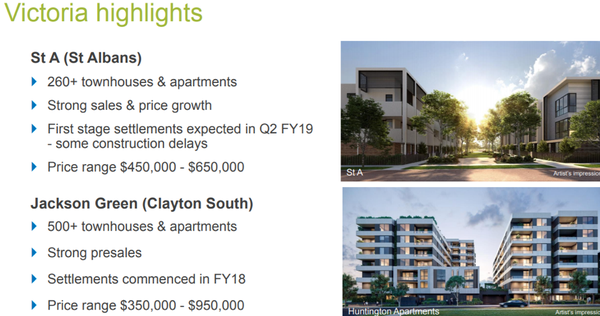
It could also be argued that Queensland, for example — where Cedar Woods is represented — hasn’t priced itself out of the market, and it is proving resilient.
The company recently noted that its projects in Victoria, South Australia (as shown in the image below) and Queensland were in better performing locations with nominal competition.
From an overall perspective, management expects that low interest rates, population growth and government incentives are the external factors that should continue to support industry conditions.
Looking specifically at Cedar Woods, management is expecting that its pre-sales of $376 million, up 21% on the previous corresponding period, combined with a long pipeline of projects and new developments that will underpin near to medium-term growth.
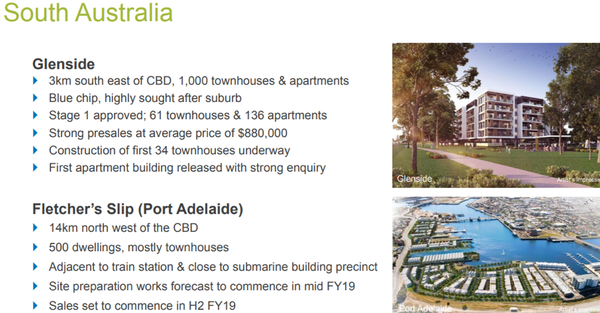
Should pockets of the market weaken, this could provide opportunities for Cedar Woods, given that it has significant balance sheet capacity to invest in new projects or expand its land bank.
WA could be the dark horse
Similar to the mining boom, the property market in Western Australia soared as cashed up miners bought into the market. However, it experienced the same boom/bust trend when the mining industry collapsed, and it has taken some time to recover.
Interestingly, Western Australia is where Cedar Woods’ origins lie and it remains the company’s headquarters.
Consequently, management knows the market well and it sees the group’s position as providing a distinct advantage ahead of an upturn in the economy.
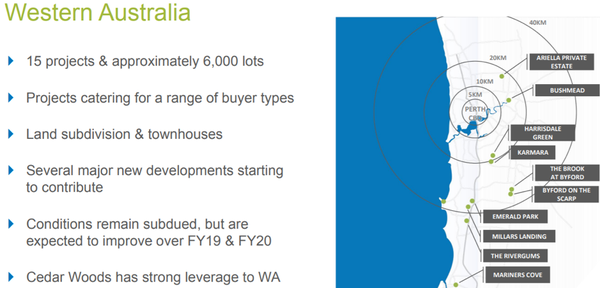
As an example, the Bushmead project, with more than 950 lots, is delivering strong margins and made its first full year contribution in fiscal 2018, with prices ranging between $168,000 and $360,000 — notably more affordable for first home buyers and easier to finance under more stringent lending conditions.
This project should run for a further eight years, while another major development at Millars Landing is expected to have a duration of between 10 and 15 years.
It has more than 1600 lots and offers similar affordability, with prices ranging between $190,000 and $210,000.
All in all, there’s plenty to like about Cedar Woods, from its historical performance through to its financial metrics — and, importantly, the projects that will be generating income in future years.
General Information Only
S3 Consortium Pty Ltd (S3, ‘we’, ‘us’, ‘our’) (CAR No. 433913) is a corporate authorised representative of LeMessurier Securities Pty Ltd (AFSL No. 296877). The information contained in this article is general information and is for informational purposes only. Any advice is general advice only. Any advice contained in this article does not constitute personal advice and S3 has not taken into consideration your personal objectives, financial situation or needs. Please seek your own independent professional advice before making any financial investment decision. Those persons acting upon information contained in this article do so entirely at their own risk.
Conflicts of Interest Notice
S3 and its associated entities may hold investments in companies featured in its articles, including through being paid in the securities of the companies we provide commentary on. We disclose the securities held in relation to a particular company that we provide commentary on. Refer to our Disclosure Policy for information on our self-imposed trading blackouts, hold conditions and de-risking (sell conditions) which seek to mitigate against any potential conflicts of interest.
Publication Notice and Disclaimer
The information contained in this article is current as at the publication date. At the time of publishing, the information contained in this article is based on sources which are available in the public domain that we consider to be reliable, and our own analysis of those sources. The views of the author may not reflect the views of the AFSL holder. Any decision by you to purchase securities in the companies featured in this article should be done so after you have sought your own independent professional advice regarding this information and made your own inquiries as to the validity of any information in this article.
Any forward-looking statements contained in this article are not guarantees or predictions of future performance, and involve known and unknown risks, uncertainties and other factors, many of which are beyond our control, and which may cause actual results or performance of companies featured to differ materially from those expressed in the statements contained in this article. S3 cannot and does not give any assurance that the results or performance expressed or implied by any forward-looking statements contained in this article will actually occur and readers are cautioned not to put undue reliance on forward-looking statements.
This article may include references to our past investing performance. Past performance is not a reliable indicator of our future investing performance.

