
Kingston resources surges more than 15%
Hey! Looks like you have stumbled on the section of our website where we have archived articles from our old business model.
In 2019 the original founding team returned to run Next Investors, we changed our business model to only write about stocks we carefully research and are invested in for the long term.
The below articles were written under our previous business model. We have kept these articles online here for your reference.
Our new mission is to build a high performing ASX micro cap investment portfolio and share our research, analysis and investment strategy with our readers.
Click Here to View Latest Articles
Event: drilling results
As the market opened yesterday, we reported that Kingston Resources Ltd (ASX:KSN) had commenced drilling at Misima North, within its flagship 2.8 million ounce Misima Gold Project , a development that could have a significant impact on the company’s share price, particularly in light of exploration success in recent months.
The Misima Gold Project is in Papua and New Guinea, and the Misima North prospect is a four kilometre target corridor trending north-north-west from the former Umuna open pit.
Kingston is accelerating its exploration initiatives across its various prospects, and commencement of this drilling program comes only a matter of weeks after the company discovered a significant new zone of high-grade shallow gold mineralisation at the Abi prospect immediately north-west of the historical Placer processing plant location at its Misima Gold Project.
Kingston managing director, Andrew Corbett highlighted the strong progress made by the company in recent months saying, “Misima North represents the third new regional target outside of the existing 2.8 million ounce resource to be drilled by Kingston, and follows the discovery of the Abi prospect within the Quartz Mountain area last month.’’
Finfeed’s take - 10.00am 9/10/2019
Recent field work and structural interpretation has elevated the potential at Misima North, suggesting that previous drilling did not properly test the shear position and subsidiary structures.
Known anomalism and mineralisation at Misima North is indicative of supergene enrichment within structures adjacent to and within the Umuna Fault Corridor.
Previous field exploration undertaken by Kingston at Misima North included three short trenches dug within the prospective Ara area which successfully intersected significant gold grades in two contact areas which featured 12 metres at 3.8 g/t gold, including grades up to 6.9 g/t gold, as well as 15 metres at 2 g/t gold.
In addition, rock chip samples were taken from prospective outcrop in the area, yielding individual spot grades as high as 44.6g/t.
Given this backdrop it was our expectation that there could be sustained share price momentum for a stock that has performed extremely well over the last three months.
Yesterday’s action
Not only do the chances of exploration success appear strong, but data collected from this program will also complement the company’s structural interpretation of the area to enhance the geological model and assist in the planning of future holes.
This will eventually feed into upgraded mineral resource estimates and subsequent studies aimed at recommencing mining at Misima, perhaps on a two-stage basis with cash flow generated from the first stage helping to fund the development of a full-scale operation.
It would appear that investors are starting to join the dots as Kingston as management consistently meets its milestones and lays the foundation for a return to production.
Tuesday's closing price of 1.9 cents represented a gain of approximately 50% in less than three months.
However, investors were quick to jump on board when the market opened yesterday, and in the first half hour the company traded as high as 2.1 cents.
By 11 AM, the stock was trading as high as 2.2 cents, representing an increase of more than 15% on the previous day’s closing price.
Kingston continued to gravitate between 2.1 cents and 2.2 cents throughout the afternoon.
However, it should be remembered that the broader market was down substantially, and there is the prospect of further upside if sentiment turns.
Will Kingston attract technical investors?
Breaking through the psychological 2.5 cents barrier could be the forerunner to a strong rally.
On a number of occasions since early 2017, the company’s shares have pushed up towards this mark only to retrace.
As the following chart shows, apart from a blip in January 2018 when the company’s shares traded above 2.5 cents for three days, one has to go back to early 2017 to see them trading above that level.
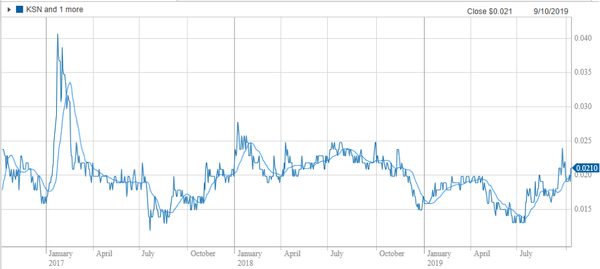
What makes this all the more interesting is the fact that there was little punctuated trading between the company trading in the vicinity of 4 cents per share and 2 cents per share.
No doubt, the chart analysts will be waiting eagerly for the buy signal perhaps around the 2.5 cents to 2.8 cents mark, although this isn’t my area of expertise.
If you aren’t a ‘charty’ or a technical analysts as they prefer to be called just watch out for the much larger than usual volumes traded as the sheer weight of numbers that invest on the back of the same ‘buy signals’ will be a dead giveaway.
While having a good-looking chart doesn’t make the company any different from an operational perspective, it normally takes strong underlying buying volumes to build towards a significant breakout.
This is normally driven by well-founded positive sentiment when it occurs over a period of time as it has done with Kingston.
Ichimoku Clouds
As a matter of interest, this is how one particular charting system has been reading Kingston over the last 12 months.
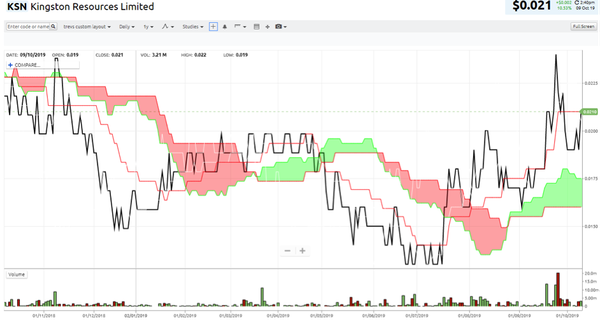
This chart is my tweaked/simplified version of Ichimoku Clouds which you can find plenty about on Google, and see it explained in much more comprehensive details.
Very broadly speaking, when the green clouds appear it is buy time and red indicates sell.
With Kingston trading well above the green cloud perimeter, the signs appear positive.
As you can see when looking across the 12 month period, like any other chart system they don’t always get it right.
However, the interesting factor with regard to this chart is the weight of buying that has driven the surge in its share price.
In some cases this will stem from investors focused purely on factors such as the company’s exploration prospects and the value of its assets.
General Information Only
S3 Consortium Pty Ltd (S3, ‘we’, ‘us’, ‘our’) (CAR No. 433913) is a corporate authorised representative of LeMessurier Securities Pty Ltd (AFSL No. 296877). The information contained in this article is general information and is for informational purposes only. Any advice is general advice only. Any advice contained in this article does not constitute personal advice and S3 has not taken into consideration your personal objectives, financial situation or needs. Please seek your own independent professional advice before making any financial investment decision. Those persons acting upon information contained in this article do so entirely at their own risk.
Conflicts of Interest Notice
S3 and its associated entities may hold investments in companies featured in its articles, including through being paid in the securities of the companies we provide commentary on. We disclose the securities held in relation to a particular company that we provide commentary on. Refer to our Disclosure Policy for information on our self-imposed trading blackouts, hold conditions and de-risking (sell conditions) which seek to mitigate against any potential conflicts of interest.
Publication Notice and Disclaimer
The information contained in this article is current as at the publication date. At the time of publishing, the information contained in this article is based on sources which are available in the public domain that we consider to be reliable, and our own analysis of those sources. The views of the author may not reflect the views of the AFSL holder. Any decision by you to purchase securities in the companies featured in this article should be done so after you have sought your own independent professional advice regarding this information and made your own inquiries as to the validity of any information in this article.
Any forward-looking statements contained in this article are not guarantees or predictions of future performance, and involve known and unknown risks, uncertainties and other factors, many of which are beyond our control, and which may cause actual results or performance of companies featured to differ materially from those expressed in the statements contained in this article. S3 cannot and does not give any assurance that the results or performance expressed or implied by any forward-looking statements contained in this article will actually occur and readers are cautioned not to put undue reliance on forward-looking statements.
This article may include references to our past investing performance. Past performance is not a reliable indicator of our future investing performance.