Investors rush to gold stocks as coronavirus spreads
Hey! Looks like you have stumbled on the section of our website where we have archived articles from our old business model.
In 2019 the original founding team returned to run Next Investors, we changed our business model to only write about stocks we carefully research and are invested in for the long term.
The below articles were written under our previous business model. We have kept these articles online here for your reference.
Our new mission is to build a high performing ASX micro cap investment portfolio and share our research, analysis and investment strategy with our readers.
Click Here to View Latest Articles
As the threat presented by the coronavirus became more evident in mid-February, investors rushed to gold, a very predictable reaction given the precious metal’s traditional safe haven status.
The price really took off on 12 February, increasing from about US$1570 per ounce to hit a high of US$1691 an ounce.
While a recent retracement has seen the price fall to somewhere in the vicinity of US$1640 per ounce, this still represents a substantial gain of about 5% in a fortnight.
The silver price has moved in similar fashion but it could be argued that it has received less recognition.
On 12 February, the silver price opened at US$17.60 per ounce and went on to trade as high as US$18.94 per ounce before losing some of those gains over the last two days.
Of course, gold tends to steal the headlines in times like these given that there are far more gold than silver explorers and producers.
To illustrate the impact of the gold rush on companies exposed to the metal, the S&P/ASX All Ordinaries gold index (ASX:XGD) increased from 7185 points on that day to peak at 7750 points on February 24.
In keeping with the pullback in the gold price, the XGD retreated to about 7420 points on Tuesday, and there was a particularly strong sell-off on Wednesday with the index down about 2.5% or nearly 200 points, and it finished the day at 7235 points.
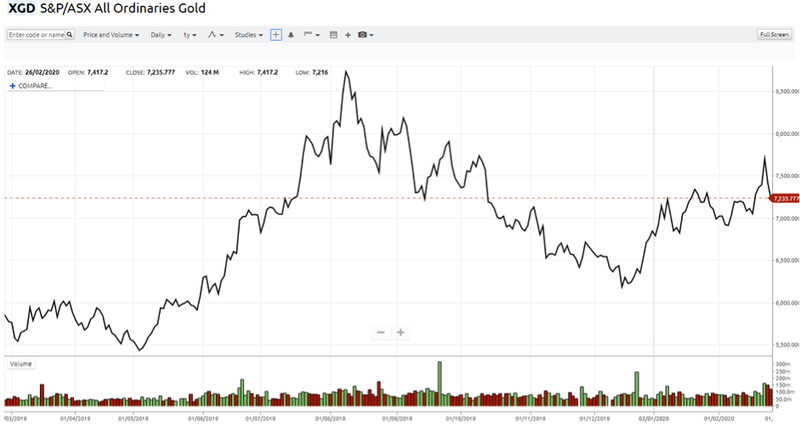
Interestingly, the XGD is only about 50 points shy of where it was a fortnight ago.
Index sitting 1500 points lower than 2019 high
Of even more significance though is the fact that the XGD is well off the 12 month high of 8730 points struck on August 8 last year.
This is difficult to fathom as last year’s rally was mainly on the back of an uptick in the commodity price which at that stage was US$1500 per ounce.
With the gold price sitting 10% above that level and the coronavirus threat impacting global markets it is difficult to justify why the XGD is trading at a 1500 point discount to where it was in August 2019.
However, the fact remains that many gold stocks have experienced strong share price gains.
On the contrary though, despite silver’s strong performance on an across-the-board basis, companies exposed to the commodity haven’t received the same support.
As is usually the case, smaller companies are usually the last to benefit from a positive change in sentiment and the first to be impacted by bad news.
White Rock Minerals Ltd (ASX:WRM) is a good example of this trend, but there are other aspects that make the group appear extremely undervalued.
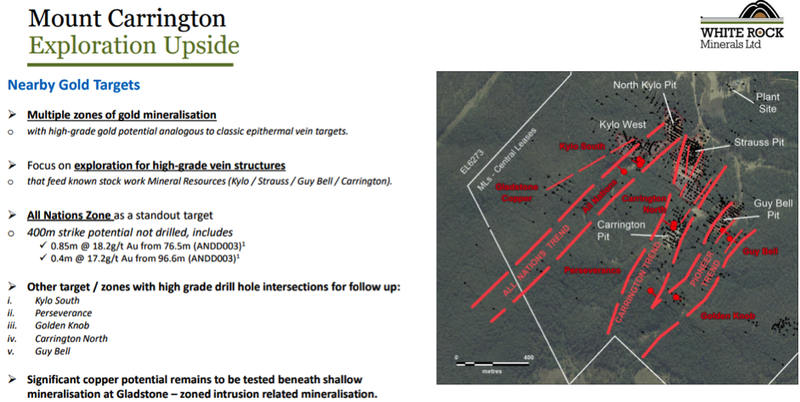
Most importantly, White Rock’s Mount Carrington gold-silver project in New South Wales tends to be overlooked.
The company’s shares failed to respond to the recent surge in gold and silver prices, and this can arguably be attributed to the fact that the group’s Red Mountain Project which is considered by the broader market as a base metals asset even though gold and silver mineralisation has been identified is the key share price driver.
Indeed, the company has had outstanding exploration success at Red Mountain and there are already two high grade deposits with an inferred mineral resource of 9.1 million tonnes at 12.9% zinc equivalent for 1.1 million tonnes of contained zinc equivalent.
Mount Carrington could add free cash flow of more than $100 million
But Mount Carrington should have a significant impact on the group’s valuation because of its established resource, existing infrastructure and the high probability of expanding what is already a project that has proven to offer strong financial returns based on an Australian dollar gold price of $1700.
The Mount Carrington Project is a 100 per cent owned advanced gold-silver epithermal project located in northern NSW, five kilometres from the township of Drake.
This asset which comprises 22 mining leases could generate substantial cash flow within two to three years.
Results of the PFS on an existing Mining Lease, and A$20 million of infrastructure from previous owners, confirmed a financially robust operation.
This includes a maiden Ore Reserve in accordance with the JORC Code (2012) for the Mount Carrington Gold First project of 159,000 ounces of gold, resources of 341,000 ounces of gold and 23.2 million ounces of silver.
The Stage One mine includes two gold resources, the Strauss and Kylo deposits, including 188,000 ounces gold (4 million tonnes at 1.4g/t gold).
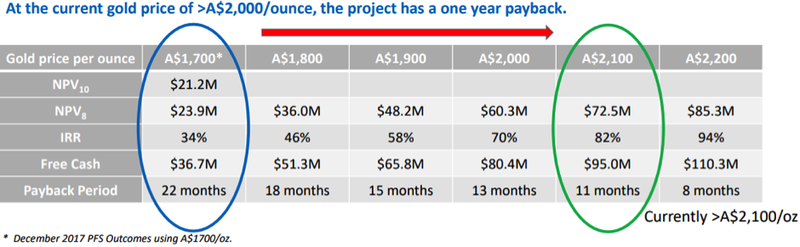
The following metrics relate to a prefeasibility study that was completed in December 2017.
Gold up, dollar down improves metrics
As illustrated above, the return on investment and free cash generation increase exponentially for every $100 increase in the gold price.
For example, free cash flow increases approximately three-fold from $36.7 million to $110.3 million when comparing an Australian dollar gold price of $1700 to $2200.
Similarly, the payback period on investment falls dramatically.
When management crunched the numbers in November the Australian dollar gold price was hovering in the vicinity of $2100 per ounce.
At that stage the Australian dollar was fetching approximately US$0.68, but it has since slumped to around US$0.655.
Meanwhile, the gold price has increased by about US$200 per ounce since November, and it is now hovering in the vicinity of US$1640 per ounce.
This implies an Australian dollar gold price of $2540 per ounce, representing a leap of 20% since November.
It is worth noting that the mine life could be increased by another 2 to 3 years if some of the JORC silver resources were included.
This has become increasingly viable with the Australian dollar silver price up from about $24.80 per ounce in November to $27.33 per ounce.
Drilling out the two remaining JORC inferred gold resources and the six nearby identified gold prospects also has the potential to considerably grow the resource, adding mine life and improved returns on capital invested.
General Information Only
S3 Consortium Pty Ltd (S3, ‘we’, ‘us’, ‘our’) (CAR No. 433913) is a corporate authorised representative of LeMessurier Securities Pty Ltd (AFSL No. 296877). The information contained in this article is general information and is for informational purposes only. Any advice is general advice only. Any advice contained in this article does not constitute personal advice and S3 has not taken into consideration your personal objectives, financial situation or needs. Please seek your own independent professional advice before making any financial investment decision. Those persons acting upon information contained in this article do so entirely at their own risk.
Conflicts of Interest Notice
S3 and its associated entities may hold investments in companies featured in its articles, including through being paid in the securities of the companies we provide commentary on. We disclose the securities held in relation to a particular company that we provide commentary on. Refer to our Disclosure Policy for information on our self-imposed trading blackouts, hold conditions and de-risking (sell conditions) which seek to mitigate against any potential conflicts of interest.
Publication Notice and Disclaimer
The information contained in this article is current as at the publication date. At the time of publishing, the information contained in this article is based on sources which are available in the public domain that we consider to be reliable, and our own analysis of those sources. The views of the author may not reflect the views of the AFSL holder. Any decision by you to purchase securities in the companies featured in this article should be done so after you have sought your own independent professional advice regarding this information and made your own inquiries as to the validity of any information in this article.
Any forward-looking statements contained in this article are not guarantees or predictions of future performance, and involve known and unknown risks, uncertainties and other factors, many of which are beyond our control, and which may cause actual results or performance of companies featured to differ materially from those expressed in the statements contained in this article. S3 cannot and does not give any assurance that the results or performance expressed or implied by any forward-looking statements contained in this article will actually occur and readers are cautioned not to put undue reliance on forward-looking statements.
This article may include references to our past investing performance. Past performance is not a reliable indicator of our future investing performance.