Exploration and commodity prices drive White Rock higher
Hey! Looks like you have stumbled on the section of our website where we have archived articles from our old business model.
In 2019 the original founding team returned to run Next Investors, we changed our business model to only write about stocks we carefully research and are invested in for the long term.
The below articles were written under our previous business model. We have kept these articles online here for your reference.
Our new mission is to build a high performing ASX micro cap investment portfolio and share our research, analysis and investment strategy with our readers.
Click Here to View Latest Articles
White Rock Minerals Ltd (ASX:WRM) released its quarterly result for the three months to 30 June, 2019 on Monday morning.
Management reminded investors that the company and its joint venture partner Sandfire Resources NL (ASX:SFR) had commenced its 2019 field exploration activities at the globally significant Red Mountain high-grade zinc and precious metals Volcanogenic Massive Sulphide (VMS) project in central Alaska.
The company reaffirmed that its 4000 metre diamond drilling campaign and a 3000 line kilometre airborne electromagnetic survey covering 500 square kilometres were well underway.
However, there have also been important macro developments that have come into play in recent weeks that arguably place even greater emphasis on upcoming events.
In recent weeks, the company traded as high as .009 cents, representing a gain of 80% in less than a month.
This has been under particularly strong volumes, and if the company goes on to surpass the psychological 1 cent per share mark, technical investors could well be attracted to the stock.
Leveraged to gold and silver
White Rock’s VMS Red Mountain Project has an Inferred Mineral Resource of 9.1 million tonnes at 12.9% zinc equivalent of which silver and gold account for a significant proportion of mineralisation.
The group’s other key asset is the Mt Carrington project in New South Wales which could be brought into production at relatively short notice.
It is a precious metal asset with a resource of 341,000 ounces of gold and 23.2 million ounces of silver with potential for resource expansion through exploration.
Consequently, as well as offering gold exposure, the group is strongly leveraged to the burgeoning silver price which is represented by the black line below, illustrating how it has even outperformed gold (green line) during the recent rally.
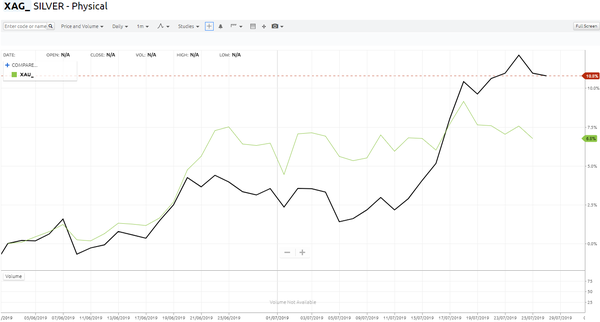
However, gold’s performance can’t be understated with the precious metal having gained US$150 per ounce in just over two months, and what investors need to understand is that they get two bites of the cherry with White Rock.
Gold and silver credits (and copper and lead) have the potential to substantially drive down the costs of production at what is shaping up as a large/low-cost zinc project at Red Mountain.
Substantial upside in Mt Carrington
Because activity around the Red Mountain Project is so intense and the current exploration campaign could increase the size of the deposit to what would be a game changing level for White Rock, the Mt Carrington project tends to be overlooked.
However, the advanced gold-silver epithermal project is supported by an impressive prefeasibility study (PFS) conducted in 2017 based on a maiden ore reserve of 3.5 million tonnes at 1.4 g/t gold for 159,000 ounces of gold within a resource of 341,000 ounces of gold and 23 million ounces of silver.
The Stage One PFS confirmed Mt. Carrington as a viable gold first project (Gold First) with significant potential upside in subsequent silver production and future gold and silver exploration.
During the quarter, strong Australian gold prices have encouraged the company to continue to explore avenues to advance the Mt Carrington Project with interested parties and several corporate advisory groups.
With the current Australian dollar gold price in excess of $2,000 per ounce there is the potential for Mt Carrington to generate a significant return on investment with an NPV8 at 2 times capital expenditure, $80 million in free cash flow generation, an internal rate of return (IRR) of 70% and a capital payback of just 13 months.
The financial model applied in the PFS assumed a long-term consensus gold price of $1700 per ounce in Australian dollar terms.
General Information Only
S3 Consortium Pty Ltd (S3, ‘we’, ‘us’, ‘our’) (CAR No. 433913) is a corporate authorised representative of LeMessurier Securities Pty Ltd (AFSL No. 296877). The information contained in this article is general information and is for informational purposes only. Any advice is general advice only. Any advice contained in this article does not constitute personal advice and S3 has not taken into consideration your personal objectives, financial situation or needs. Please seek your own independent professional advice before making any financial investment decision. Those persons acting upon information contained in this article do so entirely at their own risk.
Conflicts of Interest Notice
S3 and its associated entities may hold investments in companies featured in its articles, including through being paid in the securities of the companies we provide commentary on. We disclose the securities held in relation to a particular company that we provide commentary on. Refer to our Disclosure Policy for information on our self-imposed trading blackouts, hold conditions and de-risking (sell conditions) which seek to mitigate against any potential conflicts of interest.
Publication Notice and Disclaimer
The information contained in this article is current as at the publication date. At the time of publishing, the information contained in this article is based on sources which are available in the public domain that we consider to be reliable, and our own analysis of those sources. The views of the author may not reflect the views of the AFSL holder. Any decision by you to purchase securities in the companies featured in this article should be done so after you have sought your own independent professional advice regarding this information and made your own inquiries as to the validity of any information in this article.
Any forward-looking statements contained in this article are not guarantees or predictions of future performance, and involve known and unknown risks, uncertainties and other factors, many of which are beyond our control, and which may cause actual results or performance of companies featured to differ materially from those expressed in the statements contained in this article. S3 cannot and does not give any assurance that the results or performance expressed or implied by any forward-looking statements contained in this article will actually occur and readers are cautioned not to put undue reliance on forward-looking statements.
This article may include references to our past investing performance. Past performance is not a reliable indicator of our future investing performance.