Thomson delivers promising early stage results at Chillagoe
Hey! Looks like you have stumbled on the section of our website where we have archived articles from our old business model.
In 2019 the original founding team returned to run Next Investors, we changed our business model to only write about stocks we carefully research and are invested in for the long term.
The below articles were written under our previous business model. We have kept these articles online here for your reference.
Our new mission is to build a high performing ASX micro cap investment portfolio and share our research, analysis and investment strategy with our readers.
Click Here to View Latest Articles
Thomson Resources (ASX:TMZ) has reported promising results from soil and rock chip sampling conducted at its Chillagoe Project in North Queensland.
The project is 30 kilometres west of Chillagoe near the Mungana, Red Dome and King Vol mining operations with Cairns being the closest major city in relatively close proximity.
It comprises five granted Exploration Permits and one Exploration Permit Application covering 593 square kilometres.
The principal target type in the area is Intrusion Related Gold (IRG) deposits, and there are several such bodies known in this area that display features typical of the nearby Red Dome and Mungana IRG deposits.
A total of 466 shallow soil samples were collected across eight selected targets in October/November 2020, however, two of the original targets were inaccessible.
The prospects that were tested featured a mix of extensive untested historic workings, multiple rock chips with anomalous gold, copper, silver and base metals, and magnetic anomalies suggestive of pipe-like buried intrusions with no recorded previous mineral exploration activities.
The prospects were selected from many occurrences across a 25 kilometre by 20 kilometre area.
Soil sampling holes were drilled at 20 metre intervals across mineralised trends or magnetic anomalies.
They were drilled to solid basement and an end-of-hole sample collected.
The average depth across all 466 samples was 1.2 metres, which was shallower than expected and indicates limited dispersion of anomalies.
Data held in reports from 31,386 soil samples in the area indicates that a gold result of 14ppb Au (0.014 g/t gold) and above would be in the 95th percentile (top 5%) and highly anomalous.
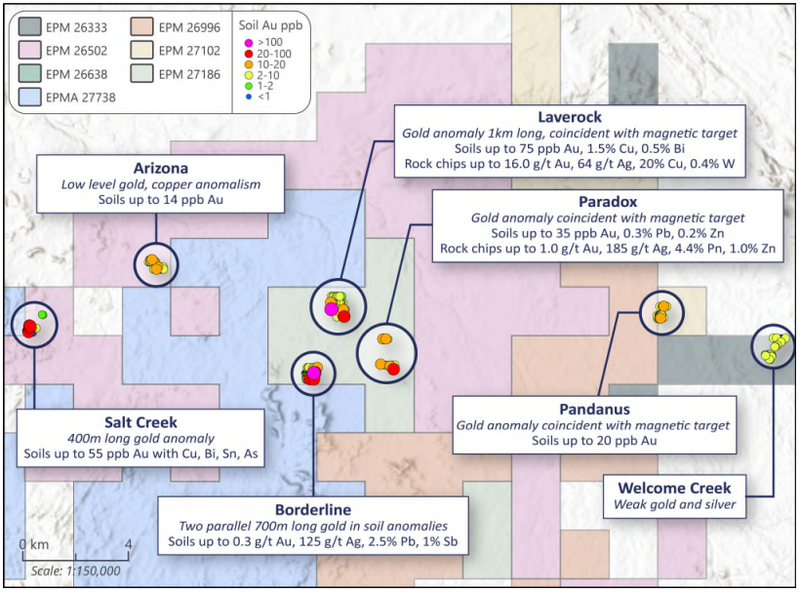
On this basis, Thomson’s program had 31 highly anomalous samples across seven of the prospects with a further 82 anomalous samples occurring across all eight of the test targets.
The following graphic shows the various areas targeted, along with the tenor of mineralisation identified.
Rock chip assay grading 16 g/t gold at Laverock
Scanning results from the various areas, one of the standouts was Laverock where Thomson identified a 1 kilometre long magnetic anomaly in the southern part of the area and four lines of auger sampling took place across it.
At the end of one of the lines was a shallow old pit which had visible copper mineralisation, and this rock chip assayed 16.0 g/t gold, 64 g/t silver and 20% copper.
The borderline prospect also delivered promising results with trenches where historical exploration had been conducted revealing a highly prospective zone where rock chips were gathered.
Multiple gold anomalous samples were assayed with best results of 13 g/t gold and 1210 g/t silver.
Salt Creek appears promising - is this a buying opportunity
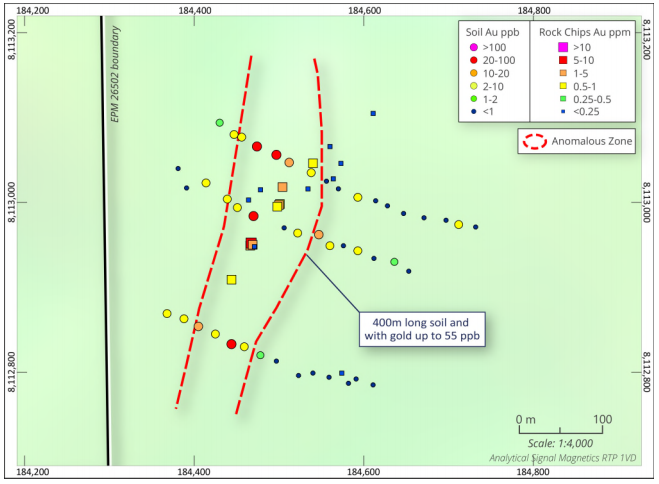
Salt Creek (EPM26502) is shaping up as an extremely promising copper-gold prospect.
A line of old shallow pits with two shafts at either end are spread out over a 200 metre long iron and quartz-rich altered lode zone in schist.
The last reported work in this area dates from 1985 (CR14744).
Of 17 rock chips collected, nine exceed 0.8 g/t gold, up to 5.7 g/t gold, while eleven exceed 1% copper, up to 24.3% copper.
As indicated below, Thomson’s soil testing intersected gold anomalies on all three lines with up to 55 ppb gold, extending the anomaly to at least 400 metres, open along strike in all directions.
Thomson has traded strongly in the last three months or so with its shares increasing more than three-fold from 6.5 cents at the start of November to hit a high of 22.5 cents at the start of February.
While they have retraced from this high in recent weeks, this can probably be attributed to profit-taking, and with further exploration results pending, this pause in momentum could represent a buying opportunity.
General Information Only
S3 Consortium Pty Ltd (S3, ‘we’, ‘us’, ‘our’) (CAR No. 433913) is a corporate authorised representative of LeMessurier Securities Pty Ltd (AFSL No. 296877). The information contained in this article is general information and is for informational purposes only. Any advice is general advice only. Any advice contained in this article does not constitute personal advice and S3 has not taken into consideration your personal objectives, financial situation or needs. Please seek your own independent professional advice before making any financial investment decision. Those persons acting upon information contained in this article do so entirely at their own risk.
Conflicts of Interest Notice
S3 and its associated entities may hold investments in companies featured in its articles, including through being paid in the securities of the companies we provide commentary on. We disclose the securities held in relation to a particular company that we provide commentary on. Refer to our Disclosure Policy for information on our self-imposed trading blackouts, hold conditions and de-risking (sell conditions) which seek to mitigate against any potential conflicts of interest.
Publication Notice and Disclaimer
The information contained in this article is current as at the publication date. At the time of publishing, the information contained in this article is based on sources which are available in the public domain that we consider to be reliable, and our own analysis of those sources. The views of the author may not reflect the views of the AFSL holder. Any decision by you to purchase securities in the companies featured in this article should be done so after you have sought your own independent professional advice regarding this information and made your own inquiries as to the validity of any information in this article.
Any forward-looking statements contained in this article are not guarantees or predictions of future performance, and involve known and unknown risks, uncertainties and other factors, many of which are beyond our control, and which may cause actual results or performance of companies featured to differ materially from those expressed in the statements contained in this article. S3 cannot and does not give any assurance that the results or performance expressed or implied by any forward-looking statements contained in this article will actually occur and readers are cautioned not to put undue reliance on forward-looking statements.
This article may include references to our past investing performance. Past performance is not a reliable indicator of our future investing performance.