
Cedar Woods Properties shows its resilience
Published 27-FEB-2019 10:09 A.M.
|
3 minute read
Hey! Looks like you have stumbled on the section of our website where we have archived articles from our old business model.
In 2019 the original founding team returned to run Next Investors, we changed our business model to only write about stocks we carefully research and are invested in for the long term.
The below articles were written under our previous business model. We have kept these articles online here for your reference.
Our new mission is to build a high performing ASX micro cap investment portfolio and share our research, analysis and investment strategy with our readers.
Click Here to View Latest Articles
Cedar Woods Properties Ltd (ASX:CWP) has delivered an impressive result for the first half of 2019, resulting in a significant share price rally on Tuesday.
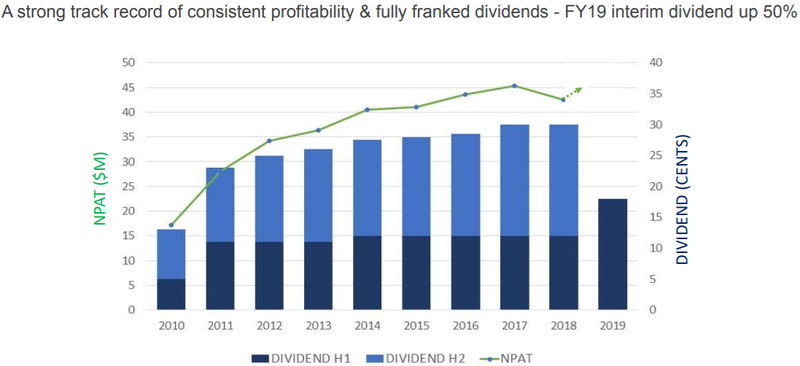
Cedar Woods has a demonstrated record of successfully navigating the ebbs and flows of property cycles throughout its history as an ASX listed company, which spans a period of more than 25 years.
The following chart shows the company’s net profits and annual dividends over the last 10 years.
The company’s share price had been under pressure over the last six months, falling from approximately $6.00 to a two-year low of $4.52 in December.
Like many other property developers, the company has been stung by negative commentary regarding a downturn in property values, difficult borrowing conditions and a reduction in construction activity in the residential housing sector.
Finfeed saw Cedar Woods as good value in mid-November, and in selecting the company as our Stock of the Week we noted that it was trading at a significant discount to consensus forecasts with an attractive PE multiple and dividend yield implied by its share price of $5.37.
Notwithstanding these metrics, there was further downside to come in December when the company briefly fell below the $5.00 mark.
Yesterday, Cedar Woods allowed its performance to speak for itself with the first half result featuring a net profit of $30.8 million, substantial pre-sales of $358 million (up from $338 million in previous corresponding period) and a fully franked dividend of 18 cents per share.
This prompted a sharp share price surge, increasing from the previous day’s close of $5.08 to a high of $5.49.
Analysts continue to expect a full year dividend of 35 cents per share, implying a 6.6% yield relative to yesterday’s closing price.
With Cedar Woods’ dividends being fully franked, the yield is one of the most compelling factors in terms of the group’s investment fundamentals.
Taking into account the franking benefits, the grossed up yield is 50 cents per share, implying a yield of 9.4%, better than that available from most real estate investment trusts (REITs) where dividends are rarely fully franked.
From an operational perspective, Cedar Woods will be generating revenues from property sales across four states in fiscal 2019, providing some insulation against pockets that have been harder hit by the property downturn.
It is also worth noting that the company offers a wide range of price points with a focus on affordability, a factor that should work in its favour in the current environment.
Looking across the four states in which the company is active, management said that conditions are positive in South Australia, moderate in Queensland, softening in Victoria and recovering at a subdued pace in Western Australia.
Notwithstanding the varied market conditions, Cedar Woods’ managing director, Nathan Blackburne said, “Cedar Woods’ strategically located projects across four states, and its diversified product mix, positions the company well to perform through property market cycles.”
Blackburne said that the company was on track to deliver a strong uplift in full year net profit in 2019.
Analysts at Hartleys have just released a note, reaffirming its ‘buy’ recommendation while slightly lowering the target price from $7.16 to $7.00, implying upside of 31% relative to yesterday’s closing price.
The implied PE multiple of 8.4 represents a substantial discount to the industry group average of 16, which is hard to fathom given the company’s compelling financial fundamentals, including its strong balance sheet which has the capacity to withstand lumpy conditions.
General Information Only
S3 Consortium Pty Ltd (S3, ‘we’, ‘us’, ‘our’) (CAR No. 433913) is a corporate authorised representative of LeMessurier Securities Pty Ltd (AFSL No. 296877). The information contained in this article is general information and is for informational purposes only. Any advice is general advice only. Any advice contained in this article does not constitute personal advice and S3 has not taken into consideration your personal objectives, financial situation or needs. Please seek your own independent professional advice before making any financial investment decision. Those persons acting upon information contained in this article do so entirely at their own risk.
Conflicts of Interest Notice
S3 and its associated entities may hold investments in companies featured in its articles, including through being paid in the securities of the companies we provide commentary on. We disclose the securities held in relation to a particular company that we provide commentary on. Refer to our Disclosure Policy for information on our self-imposed trading blackouts, hold conditions and de-risking (sell conditions) which seek to mitigate against any potential conflicts of interest.
Publication Notice and Disclaimer
The information contained in this article is current as at the publication date. At the time of publishing, the information contained in this article is based on sources which are available in the public domain that we consider to be reliable, and our own analysis of those sources. The views of the author may not reflect the views of the AFSL holder. Any decision by you to purchase securities in the companies featured in this article should be done so after you have sought your own independent professional advice regarding this information and made your own inquiries as to the validity of any information in this article.
Any forward-looking statements contained in this article are not guarantees or predictions of future performance, and involve known and unknown risks, uncertainties and other factors, many of which are beyond our control, and which may cause actual results or performance of companies featured to differ materially from those expressed in the statements contained in this article. S3 cannot and does not give any assurance that the results or performance expressed or implied by any forward-looking statements contained in this article will actually occur and readers are cautioned not to put undue reliance on forward-looking statements.
This article may include references to our past investing performance. Past performance is not a reliable indicator of our future investing performance.