
Can Cardinal deliver annual gold production of 340,000 ounces
Published 17-SEP-2018 14:50 P.M.
|
7 minute read
Hey! Looks like you have stumbled on the section of our website where we have archived articles from our old business model.
In 2019 the original founding team returned to run Next Investors, we changed our business model to only write about stocks we carefully research and are invested in for the long term.
The below articles were written under our previous business model. We have kept these articles online here for your reference.
Our new mission is to build a high performing ASX micro cap investment portfolio and share our research, analysis and investment strategy with our readers.
Click Here to View Latest Articles
Speculate aims to target stocks that tend to fly under the radar, perhaps due to the fact that they don’t suit the risk-averse investor, or simply because they are small emerging potentially next big thing stories where the market moving news is yet to break. FinFeed will be looking to uncover such stocks on a weekly basis.
Contrarian investors or those looking to target stocks that are out of favour, often identify a particular sector that is exhibiting negative sentiment before sifting through companies that appear undervalued.
For those looking to adopt such a strategy, the gold sector could well be worth a look.
Having fallen from about US$1360 per ounce in January to a 20 month low of approximately US$1170 per ounce in mid-August there is no doubting the fact that the precious metal is out of favour.
However, there was a positive sign that emerged in August in that the price rebounded immediately to more than US$1200 per ounce, and it has hovered in that vicinity for the last three weeks.
The following five-year snapshot shows that the gold price has traded in a range between approximately US$1050 and US$1400.
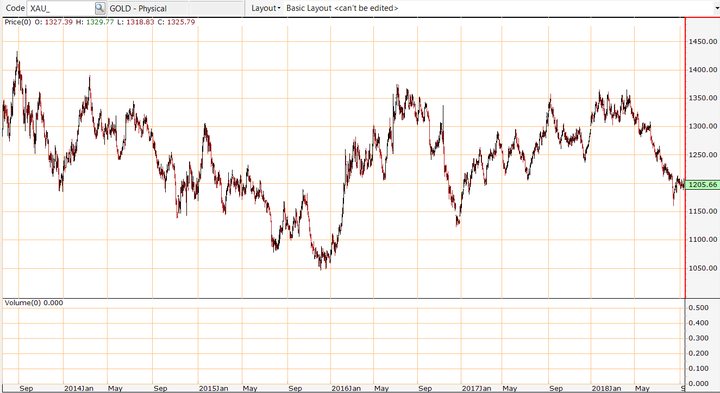
Importantly though, it has rarely traded below US$1150 and when it has slipped to that level there has been a relatively quick and strong rebound.
Examples of this can be between late October and early 2016, and more recently there was a two week period in December 2016 when the gold price fell below US$1150, but this was followed by a sustained recovery to US$1350.
It just goes to show that commodity prices do fluctuate and caution should be applied to any investment decision and not be based on spot prices alone.
Cardinal Resources bucks the trend
One way to identify stocks with prospects, which all the same have been impacted by negative sector sentiment, is to compare their share price performances against the sector trend.
While it is difficult and often somewhat misleading to gather a data bank which takes into account all gold stocks, the S&P/ASX All Ordinaries Gold Index (XGD) is a good indicator as it is home to Australia’s largest gold companies.
As indicated by the yellow line below, the index fell significantly in July/August in response to the downturn in the gold price.
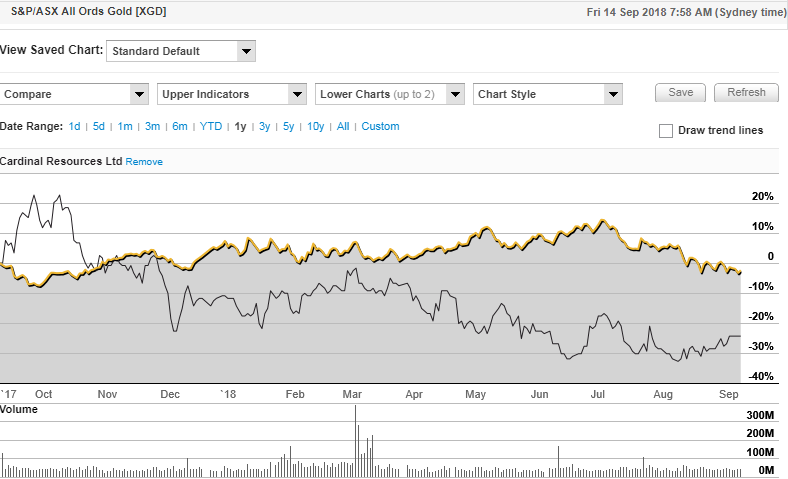
The past performance of this product is not and should not be taken as an indication of future performance. Caution should be exercised in assessing past performance. This product, like all other financial products, is subject to market forces and unpredictable events that may adversely affect future performance.
The stock I used as a point of comparison is Cardinal Resources (ASX:CDV), not a random pick, but because it is a company that I believe may be in the early stages of a significant rebound.
Note the company’s performance over the last month where it has defied the broader sector trend, gaining ground and closing the gap between it and the sector trend line.
This trend is even more prominent in the following three month chart which shows a significant outperformance against the XGD.
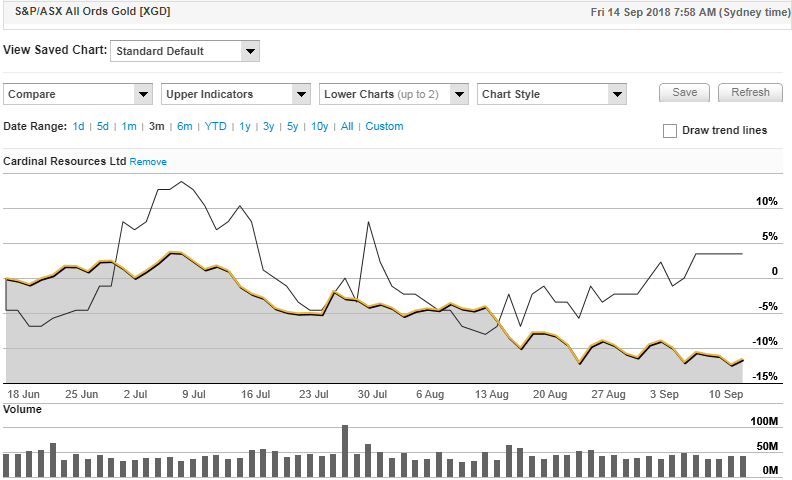
The past performance of this product is not and should not be taken as an indication of future performance. Caution should be exercised in assessing past performance. This product, like all other financial products, is subject to market forces and unpredictable events that may adversely affect future performance.
However, this stock has much more going for it than a positive chart trend, and it could be argued that the underlying reason for the outperformance is pending news regarding the company’s Namdini Gold Project in West Africa.
This is in an excellent location in terms of being in proximity to some of the world’s largest gold discoveries and producing mines as indicated below.
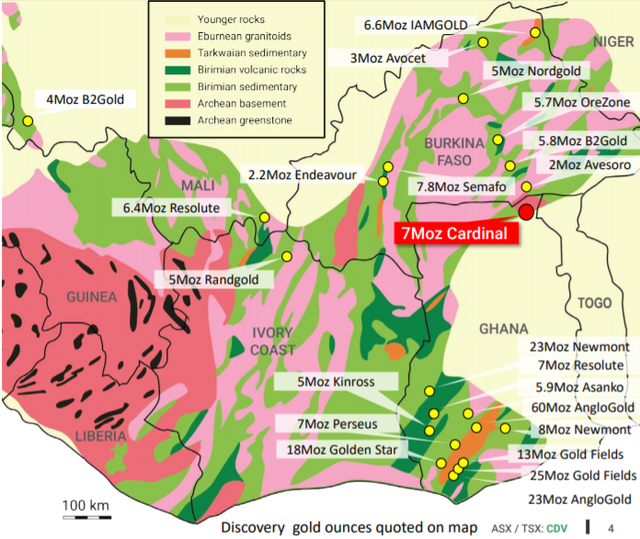
In what could be a substantial share price catalyst, Cardinal will release a prefeasibility study in the coming weeks.
A preliminary economic assessment (PEA)/scoping study released in February 2018 incorporated upgraded resources and mining schedules, along with the latest metallurgical results and refined operating and capital costs.
The PEA confirmed Namdini to be a technically and financially robust low‐cost mining opportunity, with potential to generate strong positive cashflows.
The PEA evaluated three production throughput rates, 4.5, 7.0 and 9.5 million tonnes per annum (mtpa), all delivering strong returns.
The preferred scale of development is to be selected following completion of the PFS which is scheduled to be released in September.
In addition, consideration is being given to a phased approach to the development of Namdini, commencing with a 4.5mtpa throughput that would be designed for expansion to a higher throughput.
Impressive margins, production and mine life
The PEA indicated average annual gold production in a range between 159,000 ounces per annum and 330,000 ounces per annum.
All in sustaining costs (AISC) are estimated to range between US$700 per ounce and US$800 per ounce, implying a margin of US$400 per ounce to US$500 per ounce at the current spot price.
Potential mine lifes are as follows: 9.5 Mtpa -14 years, 7.0 Mtpa -19 years and 4.5 Mtpa - 27 years.
Hartleys’ resources analyst, Mike Millikan recently highlighted the fact that Namdini remains the largest undeveloped gold project in West Africa.
He also pointed to the exploration upside of Ndongo East which lies 20 kilometres north of Namdini.
In recent weeks Cardinal informed the market that it had intersected high grade shallow intersections from drilling at Ndongo.
These included 2 metres at 27 g/t gold and 6 metres at 12.6 g/t gold.
Commenting on this development and the possible implications in terms of the Namdini Project, Cardinal chief executive Archie Koimtsidis said, “These latest shallow, significant gold intersections have provided a possible three-fold extension to the original 400 metres strike length discovery zone to 1.2 kilometres in length.
“We are increasingly encouraged at how Ndongo East is evolving with the potential to add high‐grade gold ounces to our 6.5 million ounce Namdini Gold Project located only 20 kilometres to the south.”
Potential annual production of 340,000 ounces
However, for the moment interest is centred on the upcoming Namdini PFS, as it could be a significant share price catalyst.
Millikan’s projections point to maiden production of 341,000 ounces in fiscal 2021, generating a net profit of $118 million.
His forecast is based on a gold price of US$1250 per ounce and the assumption that the company would opt for a 9.5mtpa production operation.
It should be noted that broker projections are only estimates and may not be met. Those considering this stock should seek independent financial advice.
It is worth bearing in mind that Cardinal’s market capitalisation is only $170 million, seemingly undervalued should the company be able to demonstrate that it can progress towards annual gold production of circa 340,000 ounces.
Top shelf shareholder register
Perhaps a better guide as to the company’s prospects lies in the quality of its shareholder register as indicated below.
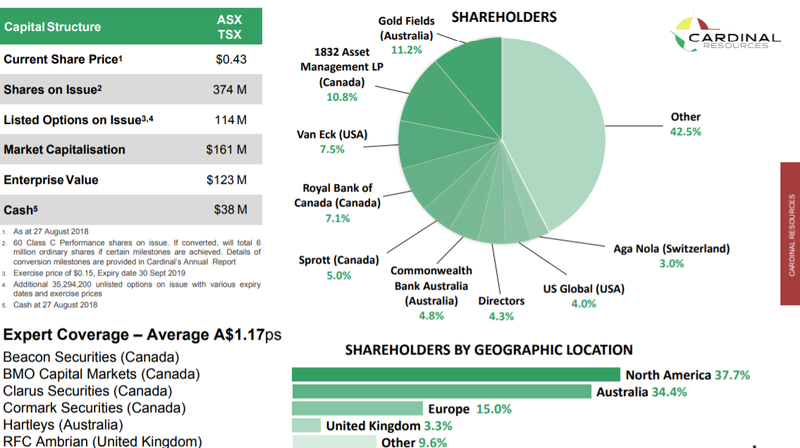
Note the company’s strong cash position of $38 million as at August 27.
While Cardinal would have to raise capital to develop a large project such as Namdini, it shouldn’t be too difficult to find support from its existing shareholder base.
Millikan is of the view that the company would probably fund the project through a 60:40 mix of debt and equity.
His valuation based on these metrics, which takes into account earnings per share dilution as a result of an equity raising, is 85 cents per share.
Applying a discounted cash flow analysis and taking into account cash and future cash value, as well as the potential for value to be realised through exploration, he has attributed a 12 month price target of 95 cents. This implies share price upside of 50 cents per share relative to the company’s last closing price of 45 cents.
Of course share prices are determined by market forces and implied values do not always translate into eventual values.
General Information Only
S3 Consortium Pty Ltd (S3, ‘we’, ‘us’, ‘our’) (CAR No. 433913) is a corporate authorised representative of LeMessurier Securities Pty Ltd (AFSL No. 296877). The information contained in this article is general information and is for informational purposes only. Any advice is general advice only. Any advice contained in this article does not constitute personal advice and S3 has not taken into consideration your personal objectives, financial situation or needs. Please seek your own independent professional advice before making any financial investment decision. Those persons acting upon information contained in this article do so entirely at their own risk.
Conflicts of Interest Notice
S3 and its associated entities may hold investments in companies featured in its articles, including through being paid in the securities of the companies we provide commentary on. We disclose the securities held in relation to a particular company that we provide commentary on. Refer to our Disclosure Policy for information on our self-imposed trading blackouts, hold conditions and de-risking (sell conditions) which seek to mitigate against any potential conflicts of interest.
Publication Notice and Disclaimer
The information contained in this article is current as at the publication date. At the time of publishing, the information contained in this article is based on sources which are available in the public domain that we consider to be reliable, and our own analysis of those sources. The views of the author may not reflect the views of the AFSL holder. Any decision by you to purchase securities in the companies featured in this article should be done so after you have sought your own independent professional advice regarding this information and made your own inquiries as to the validity of any information in this article.
Any forward-looking statements contained in this article are not guarantees or predictions of future performance, and involve known and unknown risks, uncertainties and other factors, many of which are beyond our control, and which may cause actual results or performance of companies featured to differ materially from those expressed in the statements contained in this article. S3 cannot and does not give any assurance that the results or performance expressed or implied by any forward-looking statements contained in this article will actually occur and readers are cautioned not to put undue reliance on forward-looking statements.
This article may include references to our past investing performance. Past performance is not a reliable indicator of our future investing performance.