
Robot investment reaches record US$16.5 billion
Published 25-OCT-2019 09:10 A.M.
|
6 minute read
Hey! Looks like you have stumbled on the section of our website where we have archived articles from our old business model.
In 2019 the original founding team returned to run Next Investors, we changed our business model to only write about stocks we carefully research and are invested in for the long term.
The below articles were written under our previous business model. We have kept these articles online here for your reference.
Our new mission is to build a high performing ASX micro cap investment portfolio and share our research, analysis and investment strategy with our readers.
Click Here to View Latest Articles
My obsession with robots has led me down the rabbit hole and into the burrow of the International Federation of Robotics (IFR), who have released the World Robotics report.
Last week I wrote about early stage Robocops.
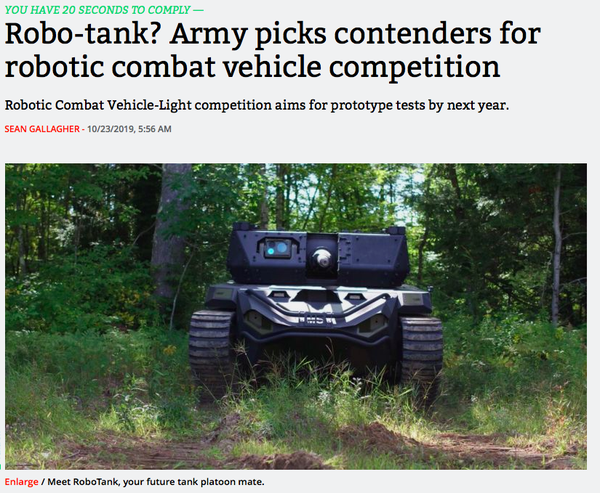
This led me to robo tanks.
And even military robots being developed by the University of Texas.
Then there is this, which is a bit scary...
However, I've said it before and I'll say it again... "Life moves pretty fast. If you don' t stop and look around once in a while, you might miss it".
Actually, Ferris said that...
Right, back to robots and the IFR... because, well, despite the military aspect, they do a great deal of things including cutting cheese (as you can see in the hero shot provided by the IFR © Staubli).
I love cheese.
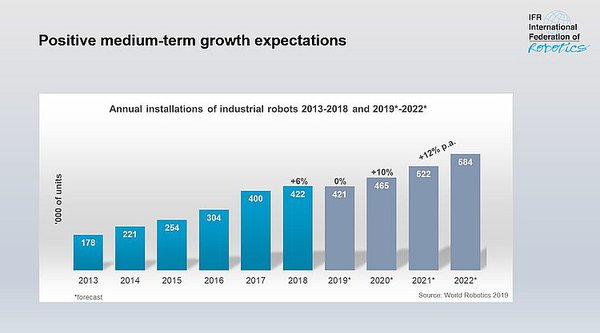
The new World Robotics report shows an annual global sales value of US16.5 billion in 2018.
That's a record.
422,000 units were shipped globally in 2018 - an increase of 6 per cent compared to the previous year. IFR forecasts shipments in 2019 will recede from the record level in 2018, but expects an average growth of 12 percent per year from 2020 to 2022.
“We saw a dynamic performance in 2018 with a new sales record, even as the main customers for robots – the automotive and electrical-electronics industry – had a difficult year,” says Junji Tsuda, President of the International Federation of Robotics.
“The US-China trade conflict imposes uncertainty to the global economy – customers tend to postpone investments. But it is exciting, that the mark of 400,000 robot installations per year has been passed for the first time. The IFR ́s longer term outlook shows that the ongoing automation trend and continued technical improvements will result in double digit growth - with an estimate of about 584,000 units in 2022.”
Asia, Europe and the Americas
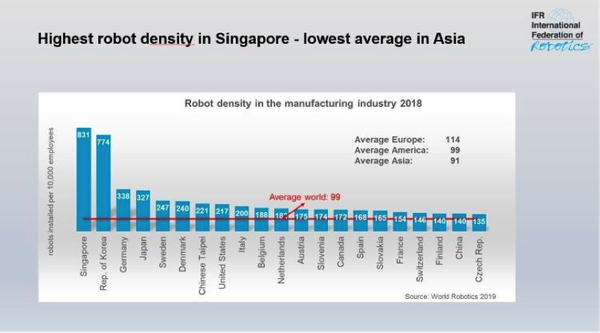
If you didn't know it before, you do now: Asia is the world’s largest industrial robot market.
Installations in China and the Republic of Korea declined, however Japan increased considerably. In total, Asia grew by 1%.
Sales of industrial robots in India reached a new record of 4,771 new units installed in 2018. That is an increase of 39 per cent compared to the previous year (2017: 3,412 units). India now ranks eleventh worldwide in terms of annual installations.
Robot installations in the second largest market, Europe, increased by 14% and reached a new peak for the sixth year in a row. In the Americas, the growth rate reached 20% more than the year before which also marks a new record level for the sixth year in a row.
Top five world markets
Five major industrial robot markets represent 74 percent of global installations in 2018: China, Japan, Republic of Korea, the United States and Germany.
China remains the world ́s largest industrial robot market with a share of 36% of total installations. In 2018, about 154,000 units were installed. This is 1% less compared to the previous year but more than the number of robots installed in Europe and the Americas together. The value of installations reached 5.4 billion USD – 21% higher than in 2017.
Chinese robot suppliers increased their share of total installations on the domestic market by 5 percentage points (2018: 27% vs. 2017: 22%). This result is in line with China ́s policy to promote domestic manufacturers. Installations of foreign robot suppliers on the other hand (including units produced in China by non-Chinese suppliers) decreased by 7% to about 113,000 units (2017: about 122,000 units). This reduction is also caused by a weakening automobile industry.
Japan ́s robot sales increased by 21% to about 55,000 units, representing the highest value ever for the country. The average annual growth rate of 17% since 2013 is remarkable for a market with an already highly automated industrial production. Japan is the world ́s number one industrial robot manufacturer and delivered 52% of the global supply in 2018.
Robot installations in the United States increased for the eighth year in a row to a new peak in 2018 and reached about 40,300 units. This is 22% higher than in 2017. Since 2010, the driver of the growth in all manufacturing industries in the U.S. has been the ongoing trend to automate production in order to strengthen the U.S. industries in both domestic and global markets. Regarding annual installations, the country has taken third position from the Republic of Korea.
The annual robot installations in the Republic of Korea declined by 5% – about 38,000 units have been sold in 2018. The robot market strongly depends on the electronics industry that had a tough year. Nevertheless, installations have increased by 12% on average per year since 2013.
Germany is the fifth largest robot market in the world and number one in Europe, followed by Italy and France. In 2018, the number of robots sold increased by 26% to almost 27,000 units – a new all-time record. Installations are mainly driven by the automotive industry.
What are the robots doing?
The automotive industry remains the largest adopter of robots globally with a share of almost 30% of the total supply (2018). After a very strong year 2017 that saw a 21% increase of installations, this level was maintained and slightly increased by 2% in 2018. Investments in new car production capacities and in modernisation have driven the demand for robots.
Using new materials, developing energy efficient drive systems and high competition in all major car markets pushed for investments. 79% of industrial robot installations took place in 5 key markets: China (39,351 units), Japan (17,346 units), Germany (15,673 units), the United States (15,246 units) and the Republic of Korea (11,034 units). Interestingly, India, the world’s fourth largest vehicle producer by OICA ́s production statistics, had just about 2,100 industrial robots installed in its automotive industry.
The electrical/electronics industry was about to replace the automotive industry as the most important customer for industrial robots in 2017. However, in 2018, global demand for electronic devices and components substantially decreased. This customer industry is probably the one most affected by the US-China trade crisis as Asian countries are leaders in manufacturing electronic products and components.
Robot installations in this industry declined by 14% from their peak level of about 122,000 units in 2017 to 105,000 units in 2018. 79% of the total installations in the electrical/electronics industry were installed in three countries with major production sites: China (43%), Republic of Korea (19%), Japan (17%). Vietnam saw a one-off boost of installations in 2017 driven by a few major projects (7,080 units), but dropped back in 2018 (689 units).
The metal and machinery industry established itself as the third largest customer industry. Installations accounted for 10% of total demand in 2018. Both producers of metal products (without automotive parts) and producers of industrial machinery, have bought substantial amounts of robots in recent years. Installations rose to about 43,500 units in 2018. This is 1% less than in the record year of 2017 (44,191 units). The metal and machinery industry was the largest customer industry in Finland (44%), Sweden (42%), Switzerland (40%), Belgium (30%), Austria (27%), Italy (26%) and Denmark (21%).
Co-botting? What the...
Collaboration is a big thing in the modern world, so why wouldn't robots want to get in on the action.
They are known as collaborative industrial robots (cobots).
Cobots are designed to perform tasks in the same workspace as human workers. The IFR definition implies that a cobot is necessarily an industrial robot as defined in ISO 8372:2012. Despite a very strong media attention of cobots, the number of units installed is still very low with a share of 3.24% only.
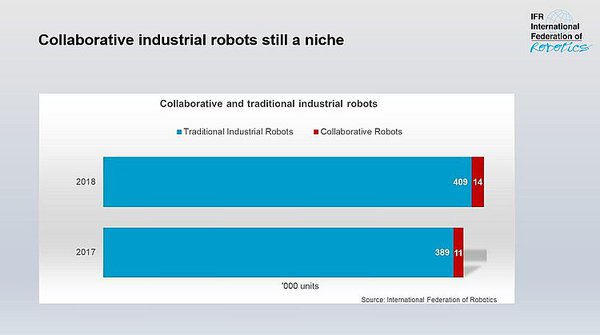
In 2018, less than 14,000 out of more than 422,000 industrial robots installed, were cobots. The year before that, roughly 11,100 units were cobots. From 2017 to 2018, annual installations of cobots increased by 23%.
Seems they are not quite as ready as we thought to collaborate, but they are moving pretty fast ... just like life.
General Information Only
S3 Consortium Pty Ltd (S3, ‘we’, ‘us’, ‘our’) (CAR No. 433913) is a corporate authorised representative of LeMessurier Securities Pty Ltd (AFSL No. 296877). The information contained in this article is general information and is for informational purposes only. Any advice is general advice only. Any advice contained in this article does not constitute personal advice and S3 has not taken into consideration your personal objectives, financial situation or needs. Please seek your own independent professional advice before making any financial investment decision. Those persons acting upon information contained in this article do so entirely at their own risk.
Conflicts of Interest Notice
S3 and its associated entities may hold investments in companies featured in its articles, including through being paid in the securities of the companies we provide commentary on. We disclose the securities held in relation to a particular company that we provide commentary on. Refer to our Disclosure Policy for information on our self-imposed trading blackouts, hold conditions and de-risking (sell conditions) which seek to mitigate against any potential conflicts of interest.
Publication Notice and Disclaimer
The information contained in this article is current as at the publication date. At the time of publishing, the information contained in this article is based on sources which are available in the public domain that we consider to be reliable, and our own analysis of those sources. The views of the author may not reflect the views of the AFSL holder. Any decision by you to purchase securities in the companies featured in this article should be done so after you have sought your own independent professional advice regarding this information and made your own inquiries as to the validity of any information in this article.
Any forward-looking statements contained in this article are not guarantees or predictions of future performance, and involve known and unknown risks, uncertainties and other factors, many of which are beyond our control, and which may cause actual results or performance of companies featured to differ materially from those expressed in the statements contained in this article. S3 cannot and does not give any assurance that the results or performance expressed or implied by any forward-looking statements contained in this article will actually occur and readers are cautioned not to put undue reliance on forward-looking statements.
This article may include references to our past investing performance. Past performance is not a reliable indicator of our future investing performance.