
Where in the world to park your money
Published 03-NOV-2017 12:15 P.M.
|
8 minute read
Hey! Looks like you have stumbled on the section of our website where we have archived articles from our old business model.
In 2019 the original founding team returned to run Next Investors, we changed our business model to only write about stocks we carefully research and are invested in for the long term.
The below articles were written under our previous business model. We have kept these articles online here for your reference.
Our new mission is to build a high performing ASX micro cap investment portfolio and share our research, analysis and investment strategy with our readers.
Click Here to View Latest Articles
Since signs of a recovery post the global financial crisis started to emerge around the 2010 mark, opinions have shifted dramatically regarding the regions which offered most upside for investors.
Even retail investors have many more options at their disposal these days in terms of tapping into overseas markets. However, it isn’t so much having the capacity to target particular markets, as it is finding a region which offers the best investment potential.
Finfeed.com has undertaken a globetrotting exercise at a time when the UK appears to be set for the first interest rate rise in 10 years, while the Trump administration could be marched inside two years.
Unconventional monetary policy blurs the picture
Making it all the more difficult is the fact that markets aren’t as easy to understand as they once were. The inverse relationship between the direction of interest rates and equities markets is no longer clear cut, as Central Bank monetary policy effectively created new money electronically to buy financial assets such as government bonds. This process aimed to directly increase private sector spending in the economy and return inflation to a preferred range at a time when economic growth was stagnant.
Quantitative easing followed by more quantitative easing dominated the headlines in the US, and this trend of artificially manipulating markets gained prominence across Europe. While it doesn’t bear the same name in Australia, the sustained downward trajectory in interest rates was a reflection of negative economic domestic and global trends.
This brings us to the UK, a country delivering its first interest rate rise in 10 years despite political instability and an uncertain future courtesy of Brexit. However, while the first in 10 years may seem an interesting milestone, the question needs to be asked whether it is of any material significance in terms of global equity markets.
Economic health should be priority, not an 0.25% rate rise
Will a move from 0.25 per cent to 0.5 per cent result in mortgage stress, depressed consumer spending and a meltdown in equities markets? History suggests not.
Consequently, with the European Union tracking in line with expectations, mixed news coming out of China and the US a political trainwreck with a brittle and uncertain economic outlook (US$4.5 trillion balance sheet), investors must be searching for some predictability. Perhaps in the form of an emerging market, similar to the BRIC (Brazil, Russia, India and China) focus adopted as the new millennium unfolded.
Of course, history shows us that the BRICs lacked the mortar to hold it all together, as they also had their ups and down. However, there has been a multifaceted dynamic change in China’s economy, and India has really fired up over the last two years with the India SENSEX stock market index surging from circa 23,000 points in early 2016 to more than 33,000 points.
In that case, should investors be looking for the next China or India? First, however, let’s not be so hasty to discount the world’s largest economy.
Is the US as good as equities markets indicate?
There has been so much focus on global geopolitical tensions and electoral manipulation in the US that investors seem to have lost sight of the fact that many of the underlying policies (most with highly material economic ramifications) that drove Trump’s ascendancy to President have not come to fruition. In fact, many of them don’t even have the support of his own party.
A large proportion of the Trump vote hinged on his ability to deliver health reform, infrastructure spending and tax relief — promises he has failed to deliver on, leaving him with a shaky hold come mid-term elections in November 2018.
That may seem a way off, especially as measured by the amount of damage the President can do via a knee-jerk tweet. But the lack of confidence in his administration could now be described as a contagion, rather than isolated pockets of doubt.
In a recent article, CNN said that top White House aides, lawmakers, donors and political consultants were privately asking whether the President realised that losing the house next year could put his presidency in peril.
Further, CNN reported, “In more than a dozen interviews, Republicans inside and outside the White House told CNN conversations are ramping up behind the scenes about whether Trump fully grasps that his feuds with members of his own party and shortage of legislative achievements could soon put the fate of his presidency at risk”.
The rise and rise of the Land of the Rising Sun
Stepping outside the major markets, Japan is letting the numbers do the talking. The JPY113.6 billion trade balance announced in September was a huge outperformance compared with consensus of JPY104.4 billion and represented the ninth consecutive monthly increase.
Exports were also up 18.1 per cent compared with the previous corresponding period. However, this data failed to create strength in the Japanese Yen, a reaction that could normally be expected.
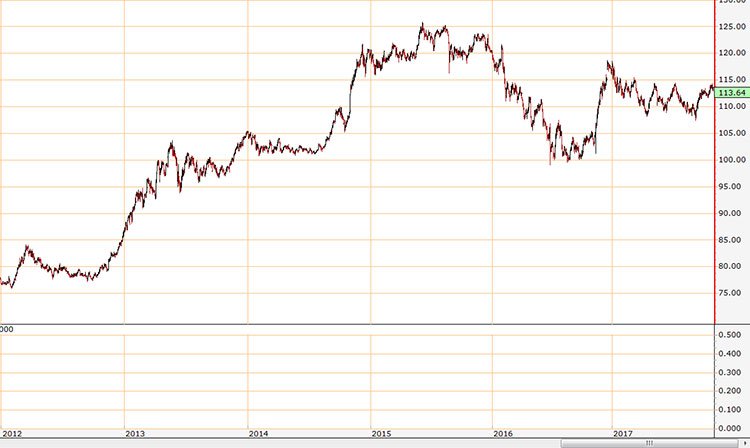
This brings us to a very important analysis of recent economic dynamics compared with historical norms. The charts below clearly demonstrate that the direction of the USD/Yen is normally mirrored by the performance of the Japanese share market.
US dollar/Japanese Yen
Japanese Nikkei Index
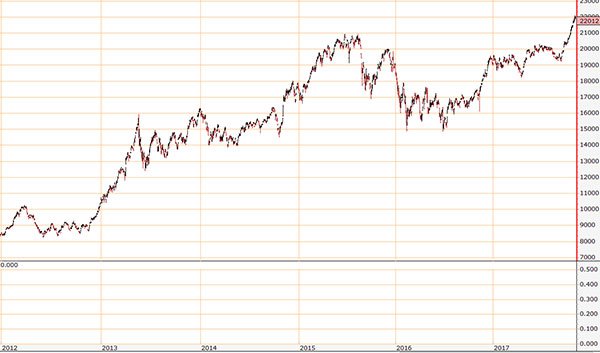
Source: Lincoln Indicators
The past performance of this product is not and should not be taken as an indication of future performance. Caution should be exercised in assessing past performance. This product, like all other financial products, is subject to market forces and unpredictable events that may adversely affect future performance.
However, this trend has been broken over the last 12 months and most decidedly since September as the Nikkei surged to an all-time high of circa 22,400 points. The index has now gained approximately 50 per cent since mid-December, creating a distinct disconnect between performance of the Japanese share market and the Yen.
By comparison, the Japanese Yen has only gained circa 5 per cent over the same period. While some could assume that this is a demonstration of confidence in the US economy, that seems a stretch.
With debt to GDP the worst in history, its administration in a state of disarray and a balance sheet that can’t mathematically fund Trump’s election promises, confidence remains scarce.
Japan marches to the beat of its own drum
The other conclusion to draw from these events is that Japan is now perceived as an economy that can run its own race with strong corporate earnings underpinned by a resurgence in its manufacturing industry, a strong position in the IT space and a burgeoning services sector.
This has also flowed through to wages growth — something that has eluded the US — and in part has been responsible for the Federal Reserve taking a conservative stance towards interest rates.
Positive headline job numbers in the US have been misleading, as it is wages growth that generates consumer spending, which feeds either directly or indirectly into nearly every sector of the economy.
It is also worth noting that activity in the construction and services sectors is likely to accelerate as the 2020 Tokyo Olympics approaches. The associated uptick in spending, as well as the long-term tourism benefits for those getting their first taste of Japan, should also help.
How Australian investors can get a chunk of Toyota and Sony
Australian investors who believe in Japan’s prospects can get a piece of the action by investing in iShares MSCI Japan ETF (ASX:IJP). As the following chart indicates, this ETF has been performing strongly, recently claiming an all-time high.
However, if this is an inflection point in the Japanese economy, there could be more upside to come.
iShares MSCI Japan ETF (ASX:IJP) – as at November 1, 2017
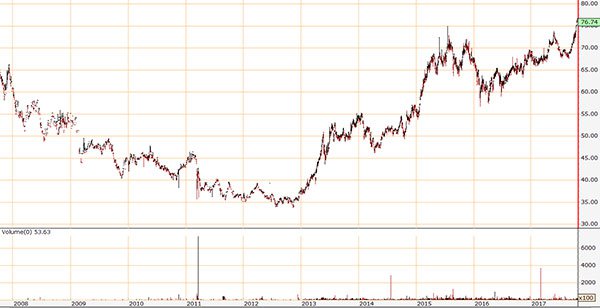
Lincoln Indicators
The past performance of this product is not and should not be taken as an indication of future performance. Caution should be exercised in assessing past performance. This product, like all other financial products, is subject to market forces and unpredictable events that may adversely affect future performance.
As the following table indicates (as at October 31, 2017), IJP provides investors with exposure to huge corporations across a wide range of industries and includes household names such as Toyota, Honda and Sony.
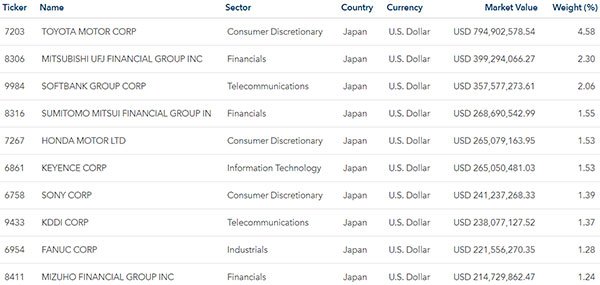
Source: www.blackrock.com
Interestingly, the average PE multiple for the portfolio is 16.6. Large financials and IT stocks in the US, particularly the latter, tend to trade on multiples well in excess of this level.
This article is General Information and contains only some information about some elements of one or more financial products. It may contain; (1) broker projections and price targets that are only estimates and may not be met, (2) historical data in terms of earnings performance and/or share trading patterns that should not be used as the basis for an investment as they may or may not be replicated. Those considering engaging with any financial product mentioned in this article should always seek independent financial advice from a licensed financial advisor before making any financial decisions.
General Information Only
S3 Consortium Pty Ltd (S3, ‘we’, ‘us’, ‘our’) (CAR No. 433913) is a corporate authorised representative of LeMessurier Securities Pty Ltd (AFSL No. 296877). The information contained in this article is general information and is for informational purposes only. Any advice is general advice only. Any advice contained in this article does not constitute personal advice and S3 has not taken into consideration your personal objectives, financial situation or needs. Please seek your own independent professional advice before making any financial investment decision. Those persons acting upon information contained in this article do so entirely at their own risk.
Conflicts of Interest Notice
S3 and its associated entities may hold investments in companies featured in its articles, including through being paid in the securities of the companies we provide commentary on. We disclose the securities held in relation to a particular company that we provide commentary on. Refer to our Disclosure Policy for information on our self-imposed trading blackouts, hold conditions and de-risking (sell conditions) which seek to mitigate against any potential conflicts of interest.
Publication Notice and Disclaimer
The information contained in this article is current as at the publication date. At the time of publishing, the information contained in this article is based on sources which are available in the public domain that we consider to be reliable, and our own analysis of those sources. The views of the author may not reflect the views of the AFSL holder. Any decision by you to purchase securities in the companies featured in this article should be done so after you have sought your own independent professional advice regarding this information and made your own inquiries as to the validity of any information in this article.
Any forward-looking statements contained in this article are not guarantees or predictions of future performance, and involve known and unknown risks, uncertainties and other factors, many of which are beyond our control, and which may cause actual results or performance of companies featured to differ materially from those expressed in the statements contained in this article. S3 cannot and does not give any assurance that the results or performance expressed or implied by any forward-looking statements contained in this article will actually occur and readers are cautioned not to put undue reliance on forward-looking statements.
This article may include references to our past investing performance. Past performance is not a reliable indicator of our future investing performance.