
Will fixtures and fittings outstrip bricks and mortar in 2017
Published 17-NOV-2016 15:16 P.M.
|
22 minute read
Hey! Looks like you have stumbled on the section of our website where we have archived articles from our old business model.
In 2019 the original founding team returned to run Next Investors, we changed our business model to only write about stocks we carefully research and are invested in for the long term.
The below articles were written under our previous business model. We have kept these articles online here for your reference.
Our new mission is to build a high performing ASX micro cap investment portfolio and share our research, analysis and investment strategy with our readers.
Click Here to View Latest Articles
It is no secret that the construction industry – bricks and mortar – is the lifeblood of the Australian economy in terms of maintaining job stability and generating household income, as well as providing significant tax income at a state and federal level.
While GDP figures during the mining boom highlight the substantial contribution that can be made when the industry is buoyant, it certainly left a big hole in the budget when boom turned to bust.
It is worth noting that the health of the residential housing sector plays a significant part in interest rate movements and broader government policy. Regards the latter, when the GST was introduced, substantially increasing the price of most housing input items, and ramping up the cost of a new house, the Federal Government responded by introducing the First Home Owner Grant in July 2000.
This demonstrates the degree of protection afforded to the housing industry. While a mining boom can turn to bust for any length of time due to global issues, governments will strive to ensure that the residential construction industry remains buoyant and/or is not negatively affected for any protracted period of time.
Can the sustained strength in the housing industry be maintained
In recent years the housing industry has been robust, assisted by a low interest rate environment which still prevails. However, house prices have increased, contributing towards the surge in first home buyers targeting outlying suburbs of major cities. This was a trend we explored when examining the property development industry.
Finfeed highlighted in September the growth being achieved by property developers and then in October the significant activity in the building materials sector underpinned by demand for housing in corridors that are well serviced by improved public transport and an expansion of essential services in outer CBD areas.
As November unfolds it is not only appropriate for Finfeed to examine another sector in the chain of spending that is part of the housing investment cycle, but it is timely in that the particular industries we highlight have shone in retail sales data for the month of September 2016, recently released by the Australian Bureau of Statistics.
As for the medium-term industry outlook, while some analysts believe it has peaked, most are tipping a plateauing or soft landing rather than a steep decline. In any case, long-term investors need to remember that signs of a downturn and subsequent share price retracement could provide a buying opportunity.
Although investors should be aware that there are risks involved in all industries and they should therefore seek professional financial advice before making any decision.
As was the case when the First Home Owner Grant was introduced, the residential construction industry invariably receives a kick start when it is struggling, ensuring the government coffers aren’t negatively affected and voters who respond to key issues such as stability of employment and homeownership remain satisfied.
Hardware, Building and Garden Supplies
The figures below show seasonally adjusted sales across a number of sectors with the first of the three columns comparing performances relative to the same month in 2015, the second column indicating the variation between the month of August 2016 and September 2016 and the third column indicating the fourth column showing the difference between turnover in the period from July 1, 2016 to September 30, 2016 compared with that period in 2015.
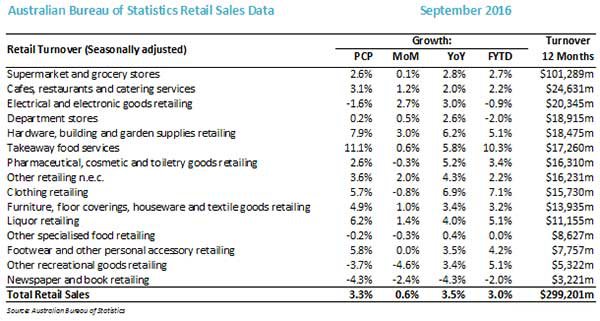
As can be seen, growth in the hardware, building and garden supplies segment has been robust on all counts, but particularly on a month on month basis (+7.9%) compared with the average growth of 0.6%, which can be an indicator of the commencement of sustained momentum.
The sector is also the second best performer compared with September 2015, and the year-to-date turnover growth of 5.1% is equal third behind takeaway foods and clothing.
The December/January holiday period can be one in which hardware sales perform well with DIY renovation projects being undertaken, and in some cases the impact of severe weather events prompting maintenance and repair.

It is also the period when substantial housing turnover occurs as employees on transfer settle into new houses. This can often be the catalyst for the purchase of new fittings as the house is decked out to fit the needs and tastes of the incoming owners.
What is the broader sector under review
Unlike the bricks and concrete companies we examined in our profile of the building materials industry, we now focus on manufacturers, distributors and retailers of many of the internal fixtures and fittings that turn the house into a home.
Products that fall under this category provide renewal, style and practicality, as well as addressing repair and maintenance issues, some urgent, but many of which have been waiting for the DIY handyman to have a few weeks off work.
The other factor to bear in mind with regard to this sector is its resilience. Often when the construction of new houses slows, it is because owners of existing houses choose to renovate rather than take on a more onerous mortgage and be hit with the normal government taxes and agents fees associated with buying and selling properties.
Where do the companies generate their income
Consequently, investors looking for exposure to the residential housing sector, but are seeking some insulation against a possible downturn in new housing construction could consider the stocks we examine.
One of the broader factors to keep in mind is that kitchens and bathrooms are the areas of the house most commonly renovated. They also tend to have fittings that endure the most wear and tear.
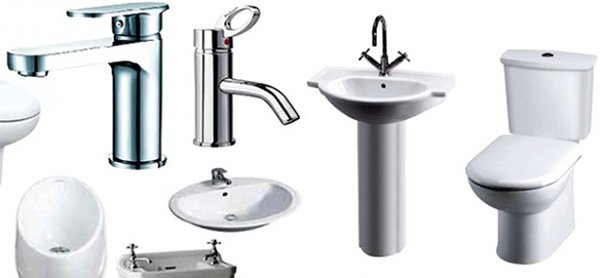
Consequently, manufacturers and distributors of products such as toilets, bathroom vanities, kitchen sinks, taps and piping are worth considering because of the natural obsolescence and in some cases the non-discretionary nature of the products – ones that leave no option but to immediately replace or repair.
Another factor to bear in mind is that some companies we examine have operations in countries outside Australia, which at times depending on industry cycles may represent some beneficial diversification.
What type of products fall into this category
Companies we cover span industries such as internal kitchen and bathroom fittings, lighting, paints, stains and adhesives. Others have divisions that specialise in door and access systems including security and electronic access control systems, including CCTV. This is a growth area as security becomes an increasingly important issue.
Finfeed also examines companies that manufacture and distribute products used in outdoor areas such as outdoor shading, synthetic grass, garden screening and pool fencing.
Most of the companies we profile service both the residential and non-residential sectors, but all generate a substantial proportion of income from the residential housing construction and renovation industry.
Beacon Lighting Group
Investors couldn’t get enough of Beacon Lighting Group (ASX: BLX) when the company listed on the ASX in April 2014. On the opening day its shares closed at $1.07, a 41 cent premium to the IPO price of 66 cents.
By the end of the month the company had traded as high as $1.15, representing an increase of 75% relative to the IPO price. While it tended to plateau out for the remainder of the year, there was a sharp spike in the first half of 2015 as it hit an all-time high of $2.23.
It is interesting to look back at the underlying factors that attracted such support because a number of the themes identified at that stage are still in place today.
Firstly, the company has brand power on its side having operated as a leading retailer of lighting products for nearly 50 years. However, what arguably interested investors was the fact that the group had an exclusive range of lighting products that provided barriers to entry in a particularly competitive industry.
It was also a time of innovative change in the lighting industry with massive investment in solid-state lighting, leading to an acceleration in the take-up of LED products and other more efficient systems.
Because BLX was perceived as a market leader in this area with the prospect of growth by store rollout there was an expectation of the company delivering superior margins and earnings accretion to industry peers, suggesting the company was poised for a period of rapid growth.
Indeed, in the company’s prospectus BLX highlighted the fact that it was Australia’s largest and leading retail lighting specialist with a proven retail model capable of delivering growth through store expansion, as well as the establishment of a robust vertically integrated business, offering supply chain optimisation through the importing, distribution and retail channels.
More stores but minimal growth and margin contraction
However, as can be seen below, just looking at fiscal 2016, the anticipated growth hasn’t materialised despite store expansion and supportive industry conditions.
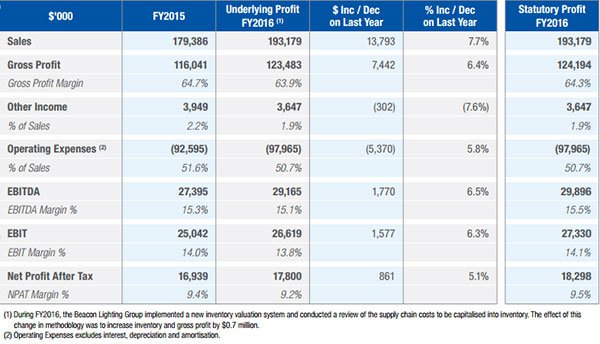
Step back to mid-fiscal 2015 and Morgans CIMB were forecasting earnings per share growth of 10.4% and 8.2% in fiscal years 2016 and 2017 respectively. Analyst, Josephine Little released a note this week downgrading earnings per share forecasts for each year between fiscal 2017 and 2019 inclusive by circa 6%. The company is now only expected to generate growth of less than 1% in 2017 followed by 13.6% in 2018.
In the last 12 months BLX has been sold down from a December 2015 high of $2.20 to a low of $1.18 in May before recovering to circa $1.90. However, in the last month its shares have traded as low as $1.48, and even at that price it is difficult to justify an investment in the stock.
Interestingly, Little reduced her price target from $1.78 to $1.66, and even though the stock was trading at $1.53 at the time she lowered the recommendation from add to hold. The company looks more comfortably priced around the 12 month low of $1.18 which would imply a fiscal 2017 PE multiple of 13.3 relative to Little’s forecasts.
Lighting industry has had a chequered history
It is worth noting that the lighting industry has been somewhat of a graveyard for ASX listed companies.
As this is the case, investors should take extra caution in making an investment decision relating to this industry and seek professional financial advice before making their decision.
Lighting Corporation attempted to make the most of industry consolidation, also banking on its brand power to grab market share.
Gerard Lighting chanted a similar mantra, as well as promising shareholders that it would assert its authority by capitalising on the smart lighting industry, another familiar tune. In 2011/2012 the company’s shares plunged from $1.00 to less than 70 cents prior to a takeover by Champ Private Equity.
Given this backdrop and the fact that BLX is yet to prove itself in terms of delivering the earnings growth to justify a premium PE multiple, there appear to be better options available.
DuluxGroup
DuluxGroup (ASX: DLX ) is another company with big brands that has come unstuck in the last 12 months.
As a manufacturer and marketer of products that protect, maintain and enhance spaces and places at a commercial and residential level, the company has made its mark on the global stage with prominent brands such as Dulux, British Paints, Selleys, Cabot’s and Yates leading the way in the paints, coatings, adhesives and garden care markets.
DLX also has some high profile brands in the door industry including B&D Doors and Openers, Garador and the Dominator. From a broader perspective, the company has performed extremely well share price wise since the Orica demerger which occurred in 2010.
In the ensuing five years the company’s shares increased from circa $2.50 to hit an all-time high of $6.88 in April last year. As can be seen below this was driven by a combination of consistent profit and dividend growth.
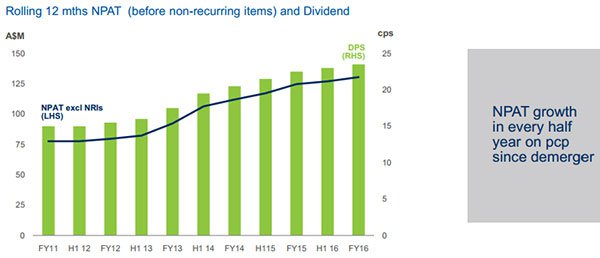
As indicated, that began to taper in 2015 and beyond, and less than six months later the company’s shares were trading close to $5.00.
Despite a recovery to the $6.80 mark in January 2016, DLX recently hit a 12 month low of $5.91. This coincided with the release of the group’s fiscal 2016 result, which in a case of unfortunate timing coincided with Donald Trump’s victory.
Consequently, the subsequent sharp decline in share price has arguably been misleading with the broader investment community attributing it to a poor fiscal 2016 performance. However, as noted by Alexander LU from Morgans CIMB and Macquarie Wealth Management the result was in line with expectations.
That said, there were some areas which analysts saw as a little weak. In particular, Macquarie highlighted the underperformance of the garage doors and openers business as it repositions its channel strategy and faces challenges in PNG.
However, the broker slightly increased earnings per share forecasts for fiscal years 2017 and 2018 while maintaining its neutral recommendation and price target of $6.30. This is broadly in line with Morgans CIMB, which has a hold recommendation on the stock with a price target of $6.34.
When the analyst reviewed the result, DLX was trading in the vicinity of $6.20, suggesting the subsequent retracement to a low of $5.91 may bring the company into buy territory.
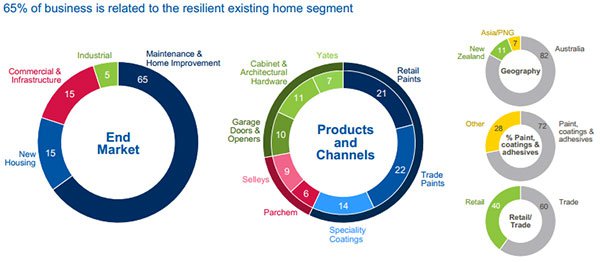
Managing Director, Patrick Houlihan, delivered a positive outlook statement, highlighting that the group’s core existing home renovation markets which account for circa 65% of group revenue are expected to continue to provide resilient profitable growth.
He also noted that the pipeline of projects and new housing activity (circa 15% of group revenue) is expected to remain relatively strong. Bearing these factors in mind and subject to economic conditions he expects that the 2017 net profit after tax will be higher than 2016, excluding non-recurring items.
One of the most appealing aspects of DLX’s business is its strong brands and diversification which provide competitive advantages and a degree of insulation against cyclical trends. The extent of this diversification can be seen below.
Gale Pacific
Gale Pacific (ASX: GAP) is a leading manufacturer and marketer of advanced polymer textiles and value-added products. The group produces globally recognised Coolaroo domestic shade cloth and leisure products which include shade sails, gazebos, umbrellas and window coverings.
In recent years the company has expanded into new areas and it now has a retail range of DIY window furnishings and glass products under the Zone Interior and Everton brands. The latter is particularly popular in Australia where the warmer climate lends itself to outdoor entertainment which incorporates fitting out decks, swimming pools and entertainment areas.
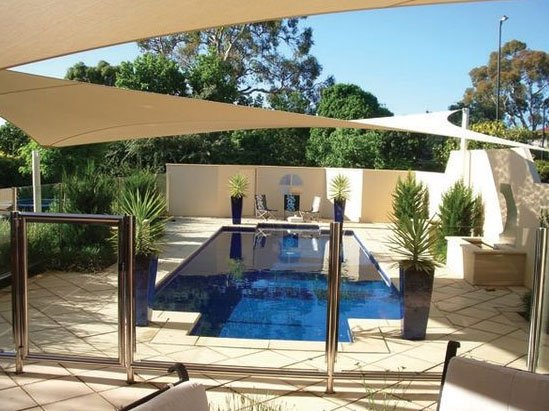
Glass fencing has become a specialty area, having come a long way from the aluminium piping look. At the same time, manufacturers and distributors have had to move with regulatory conditions in providing safe but stylish products.
Glass has become a popular option from an aesthetic perspective as it facilitates full view of entertainment areas including features such as swimming pools. As can be seen below, this type of product is no longer just a security measure, but a feature in many backyards.

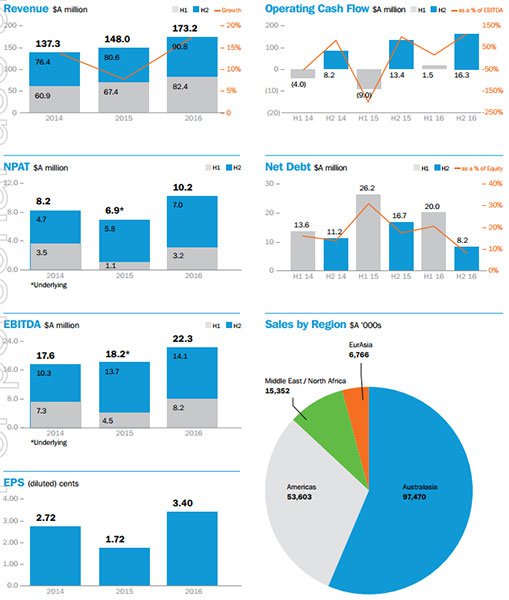
Looking at the overall business, while GAP generated approximately 60% of revenue from Australasia in fiscal 2016 there were also important contributions from the European, Asian and American regions which accounted for circa $65 million of group sales ($173 million).
The company generated impressive growth in fiscal 2016 with a 47% increase in underlying profit after tax struck on the back of a 17% increase in revenue. GAP’s balance sheet was strengthened substantially with net debt falling from $16.7 million to $8.2 million leaving it well-placed to fund a range of initiatives including product innovation and supply chain management.
The following is a useful snapshot of the company’s financial progress over recent years, as well as its positioning in key markets.
The recent retracement in the company’s shares to circa 35 cents could represent a buying opportunity given that they are now trading on a PE multiple of just over 10 relative to fiscal 2016 earnings.
Ian Munro from CCZ Equities Research has a buy recommendation on the stock with a price target of 50 cents, representing a premium of nearly 50% to the company’s recent trading range.
Munro noted that the group has a strong relationship with Bunnings Australia with its product range represented in 14 different aisles within the group’s 240 store footprint across Australia.
More specifically, he highlighted that Coolaroo is a category leader with an estimated 80% share of the outdoor sail/shelter shelf space in Bunnings. In fiscal 2016 Bunnings accounted for $62 million in sales, representing 36% of group income.
He sees the closure of the Masters hardware chain and positive Bunnings outlook as supporting continued medium-term growth, particularly in relation to the Coolaroo brand.
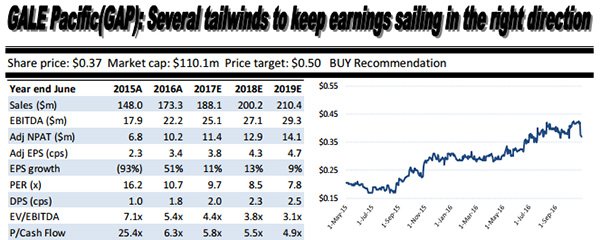
As indicated above, Munro is forecasting a fiscal 2017 net profit of $11.4 million, representing earnings per share of 3.8 cents, implying a PE multiple of circa 10 relative to the company’s current trading range.
Given GAP is cycling against a year of substantial growth in 2016, but is still expected to maintain double-digit growth in the ensuing three years, the group appears conservatively priced.
GWA Group
GWA’s (ASX: GWA) divisions are split into two segments, Bathrooms and Kitchens and Door and Access Systems. The company is a much cleaner operation today with the group having rationalised its businesses, maintaining those where it has strong brand names and competitive advantages with good supply chain management.
The latter has taken some work in recent years as management took some hard decisions in terms of refocusing the business. This involved the divestment of its Dux, Brivis and Gliderol businesses.
Management recently highlighted that it had successfully reduced corporate costs, part of its overall program to generate between $13 million and $15 million in cost savings progressively from fiscal 2016 through to fiscal 2019.
These initiatives have improved the company’s financial position with net debt down 7% and operating cash flow up 12%.
The 15% increase in net profit to $51.9 million represented a significant turnaround compared with fiscal 2015 which was affected by restructuring initiatives.
As previously mentioned, bathrooms and kitchens lead the way as far as renovations are concerned, leaving the group strongly leveraged to an increase in activity in that market segment should new housing waiver.
The following update provided at the group’s AGM in late October provided an indication of how its key markets have performed in the three months to September 30, 2016. It is worth noting that sales generated by its bathroom and kitchens division were up 3% on the back of a 1% increase in the renovation and replacement market.
The group has market leading brands covering most price points in this sector. These include Caroma, Clark, Stylus, Dorf and Fowler. Management expects that new product launches (taps and showers) will assist in driving growth in the renovation and replacement market in fiscal 2017.

The Door and Access business also boasts strong brands including Gainsborough, Austral and API. With GWA a leading Australian designer, manufacturer importer and distributor of a comprehensive range of access and security systems for use in residential and commercial premises it is well-positioned in a sector that should experience considerable organic growth in coming years as security becomes an increasingly important feature across all areas of construction.

While this division’s revenue has only experienced nominal growth in fiscal 2016, exposure to the Western Australian market where housing construction has slumped weighed on the stronger regional performances in New South Wales (+7%) and Victoria (+12%).
However, the Bathrooms and Kitchens division is central to the company’s success given that it accounted for $342 million in revenue in fiscal 2016 compared with the $97.7 million generated by the Door and Access Systems business.
Alexander LU reviewed GWA after the company delivered its fiscal 2016 result, increasing his fiscal 2017 forecast earnings before interest and tax by 3.3% to $80.3 million. He also substantially upgraded his price target from $2.28 to $2.57.
However, as the company was trading at $2.68 at the time he maintained a hold recommendation. Given GWA is still trading above the price target and appears to have settled in a range between $2.80 and $3.00, there appears to be better value elsewhere.
Reece Group
Reece Group (ASX: REH) is one of the best performers in this sector, providing both consistency of earnings and dividend growth, as well as demonstrating its resilience in weathering challenging industry conditions in past years.
Reece also benefits from activity in the renovations and repairs market through its exposure to spending on bathroom and plumbing supplies. REH’s high profile brands include Laufen (Switzerland), Roca (Spain) and AXA (Italy), with all of them featuring a long history and prominent heritage.
This brand power extends to the plumbing supplies sector where it distributes world-renowned brands including Rothenberger, Arco and Geberit, as well as leading Australian brands such as Auspex and Graf.

The fiscal 2016 result featured a 9.2% increase in sales to $2.27 billion. This provided the foundation for a 16.1% increase in net profit which was a record $192.2 million.
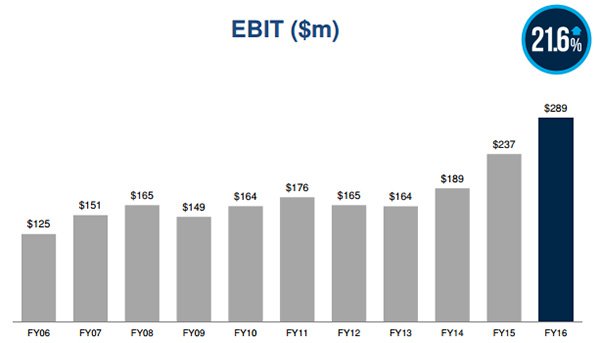
However, because there were some one-off items, earnings before interest and tax was arguably a better measure of the performance. EBIT increased from $237 million in fiscal 2015 to $289 million in fiscal 2016.
Importantly, the EBIT to sales margin increase by 130 basis points, indicating the company is not only growing, but it continues to improve efficiencies.
This has been assisted by the establishment of a distribution centre in Perth and the imminent opening of a new distribution centre in Sydney which should drive further supply chain improvements.
The company has an extensive and growing network of 577 stores throughout Australia which leave it well-positioned to continue generating strong sales growth.
REH has a market capitalisation of $4.2 billion and is trading on a PE multiple of 22 relative to fiscal 2017 forecasts. However, PE multiples don’t really do the company justice as they do not account for the company’s strong balance sheet and net assets which totalled more than $1 billion as at June 30, 2015.
The company’s shares are also thinly traded and with limited broker coverage REH tends to fly under the radar. However, its consensus price target is $49.79, implying upside of circa 15% to the group’s current trading range.
It is worth bearing in mind that REH has delivered 50 consecutive halves of profitability and this no doubt has been a factor in attracting leading institutional investors such as JP Morgan, Citicorp, UBS and BNP Paribas.
Of course there is no guarantee that this kind of performance will continue and investors should keep this in mind when considering this stock for their portfolio and maintain a cautious approach with regard to their investment decisions.
Reliance Worldwide Corporation
While Reliance Worldwide Corporation (ASX: RWC) only listed on the ASX in April 2016 it is an established player in the small diameter pipe, valve and fitting market.
The following chart demonstrates how the company has taken advantage of a fragmented industry and grown the business over the last 13 years.
It is significant that much of this growth has been underpinned by the group’s innovation in bringing new products to market as this has been flagged as a continuing focus in terms of maintaining the group’s growth trajectory.
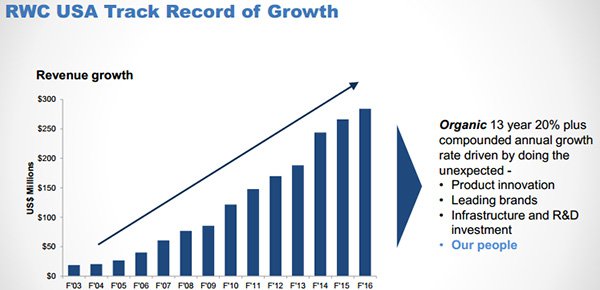
Management recently highlighted that there isn’t a dominant competitor in this market segment, providing the group with substantial opportunities to generate organic and acquisition led growth.
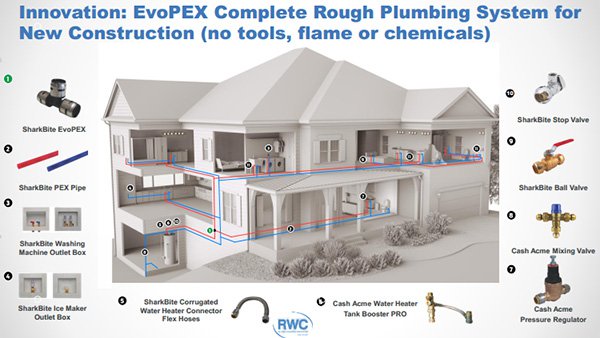
While its segment coverage may sound limiting, the following graphic demonstrates just how many applications there are in the residential housing sector for its products.
RWC couldn’t have got off to a better start as a listed entity, delivering a fiscal 2016 result that was ahead of prospectus forecasts on a sales and EBITDA basis.
The group generated EBITDA of $17.3 million from sales of $98.3 million in the statutory period, but pro forma sales taking into account the full 12 months were up 18% to $534.4 million.
Pro forma EBITDA was up 25% to $99.1 million, illustrating the strong margins generated by this business, typical of an operation that has significant pricing power due to its substantial share of a fragmented market.
RWC generated strong growth from the Americas, and this is expected to continue in 2017 as the group increases its retail distribution presence in the US.
The company also generated strong cash flow in fiscal 2016 with free cash flow conversion reaching 84.2% against the prospectus forecast of 74.2%. The balance sheet finished in a robust position and there is head room to fund further growth.
Analysts at Macquarie Wealth Management are forecasting earnings per share growth of 18.7% in fiscal 2017. The broker has an outperform recommendation on the stock with a 12 month price target of $3.40.
The company rebounded from a 12 month low of $2.74 in early November after management provided an update and outlook statement indicating the group was on track to deliver the full-year profit forecast for fiscal 2017 provided in the prospectus.
RWC is currently trading in the vicinity of $3.00, offering reasonable upside relative to Macquarie’s 12 month price target.
Note that broker projections and price targets are only estimates and may not be met. Also, historical data in terms of earnings performance and/or share trading patterns should not be used as the basis for an investment as they may or may not be replicated. Those considering the stocks in this article should seek independent financial advice.
General Information Only
S3 Consortium Pty Ltd (S3, ‘we’, ‘us’, ‘our’) (CAR No. 433913) is a corporate authorised representative of LeMessurier Securities Pty Ltd (AFSL No. 296877). The information contained in this article is general information and is for informational purposes only. Any advice is general advice only. Any advice contained in this article does not constitute personal advice and S3 has not taken into consideration your personal objectives, financial situation or needs. Please seek your own independent professional advice before making any financial investment decision. Those persons acting upon information contained in this article do so entirely at their own risk.
Conflicts of Interest Notice
S3 and its associated entities may hold investments in companies featured in its articles, including through being paid in the securities of the companies we provide commentary on. We disclose the securities held in relation to a particular company that we provide commentary on. Refer to our Disclosure Policy for information on our self-imposed trading blackouts, hold conditions and de-risking (sell conditions) which seek to mitigate against any potential conflicts of interest.
Publication Notice and Disclaimer
The information contained in this article is current as at the publication date. At the time of publishing, the information contained in this article is based on sources which are available in the public domain that we consider to be reliable, and our own analysis of those sources. The views of the author may not reflect the views of the AFSL holder. Any decision by you to purchase securities in the companies featured in this article should be done so after you have sought your own independent professional advice regarding this information and made your own inquiries as to the validity of any information in this article.
Any forward-looking statements contained in this article are not guarantees or predictions of future performance, and involve known and unknown risks, uncertainties and other factors, many of which are beyond our control, and which may cause actual results or performance of companies featured to differ materially from those expressed in the statements contained in this article. S3 cannot and does not give any assurance that the results or performance expressed or implied by any forward-looking statements contained in this article will actually occur and readers are cautioned not to put undue reliance on forward-looking statements.
This article may include references to our past investing performance. Past performance is not a reliable indicator of our future investing performance.