
Velocity of Money Slowdown
Published 27-JAN-2017 15:47 P.M.
|
2 minute read
Hey! Looks like you have stumbled on the section of our website where we have archived articles from our old business model.
In 2019 the original founding team returned to run Next Investors, we changed our business model to only write about stocks we carefully research and are invested in for the long term.
The below articles were written under our previous business model. We have kept these articles online here for your reference.
Our new mission is to build a high performing ASX micro cap investment portfolio and share our research, analysis and investment strategy with our readers.
Click Here to View Latest Articles
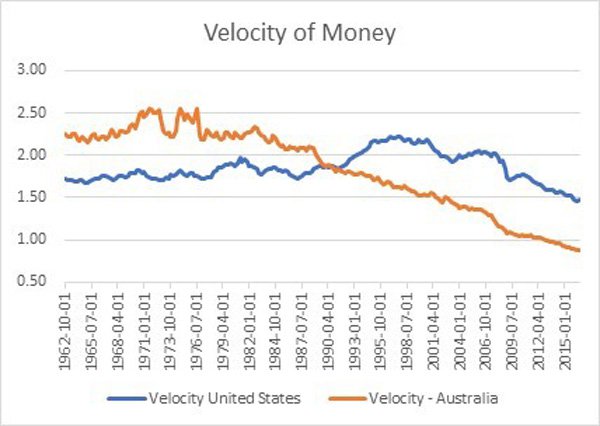
The velocity of money is the rate at which the total supply of money (M3) is turned over in the economy (Gross National Product) writes Mike Cornips.
M3 is a measure of the supply of money that includes cash, short term deposits in banks and money market funds, large time deposits and other liquid assets. Think of it like a business. Your money supply is the amount of working capital you have employed in the business. To be profitable, you need turnover that working capital as many times in one year. If you have $1million in working capital and $5million in annual revenue, then you have turned over (ie Velocity) your working capital 5 times in the year. To increase your profitability, you need to increase the velocity of your capital.
The graph below clearly demonstrates that in both the United States and Australia, the velocity is in a remarkable downtrend, and more so for Australia.
The past performance of this product is not and should not be taken as an indication of future performance. Caution should be exercised in assessing past performance. This product, like all other financial products, is subject to market forces and unpredictable events that may adversely affect future performance.
To put it into context, back in the pre-money printing days, for a single dollar increase in the money supply resulted in a two dollar plus increase in the Gross National Income. To put it in another way, a dollar increase in working capital resulted in a $2 plus increase in revenue.
Currently in Australia, for 12 months to July 2016, M3 money supply increased by $107 Billion. For the same 12 months, Gross National Income only increased by $44 Billion. So, a dollar increase in money supply only increased national income by 41 cents. The increase in Money Supply mirrors the increase in total debt.
In the US, for every $1 increase in M2 (M3 is no longer published in the US), the Gross National Income increased by 65 cents.
In the US the velocity peaked in the late 1990’s (dot-com crash), and in Australia it peaked during the recession in the early 1980’s.
The graph shows that rapid deacceleration of Velocity (print more money relative to national income increases) coincides with an economic downturn – late 1980’s, late 1990’s to 2001, and the GFC in 2007-08.
The Keynesians amongst us would never have a problem more debt couldn’t solve, but if I had to borrow $1 million to increase my revenue by 41 cents or less, I probably would say it was silly.
General Information Only
S3 Consortium Pty Ltd (S3, ‘we’, ‘us’, ‘our’) (CAR No. 433913) is a corporate authorised representative of LeMessurier Securities Pty Ltd (AFSL No. 296877). The information contained in this article is general information and is for informational purposes only. Any advice is general advice only. Any advice contained in this article does not constitute personal advice and S3 has not taken into consideration your personal objectives, financial situation or needs. Please seek your own independent professional advice before making any financial investment decision. Those persons acting upon information contained in this article do so entirely at their own risk.
Conflicts of Interest Notice
S3 and its associated entities may hold investments in companies featured in its articles, including through being paid in the securities of the companies we provide commentary on. We disclose the securities held in relation to a particular company that we provide commentary on. Refer to our Disclosure Policy for information on our self-imposed trading blackouts, hold conditions and de-risking (sell conditions) which seek to mitigate against any potential conflicts of interest.
Publication Notice and Disclaimer
The information contained in this article is current as at the publication date. At the time of publishing, the information contained in this article is based on sources which are available in the public domain that we consider to be reliable, and our own analysis of those sources. The views of the author may not reflect the views of the AFSL holder. Any decision by you to purchase securities in the companies featured in this article should be done so after you have sought your own independent professional advice regarding this information and made your own inquiries as to the validity of any information in this article.
Any forward-looking statements contained in this article are not guarantees or predictions of future performance, and involve known and unknown risks, uncertainties and other factors, many of which are beyond our control, and which may cause actual results or performance of companies featured to differ materially from those expressed in the statements contained in this article. S3 cannot and does not give any assurance that the results or performance expressed or implied by any forward-looking statements contained in this article will actually occur and readers are cautioned not to put undue reliance on forward-looking statements.
This article may include references to our past investing performance. Past performance is not a reliable indicator of our future investing performance.