
Valuing an IPO
Published 04-AUG-2017 14:00 P.M.
|
3 minute read
Hey! Looks like you have stumbled on the section of our website where we have archived articles from our old business model.
In 2019 the original founding team returned to run Next Investors, we changed our business model to only write about stocks we carefully research and are invested in for the long term.
The below articles were written under our previous business model. We have kept these articles online here for your reference.
Our new mission is to build a high performing ASX micro cap investment portfolio and share our research, analysis and investment strategy with our readers.
Click Here to View Latest Articles
It can be very difficult to determine the fair value of an IPO. History would suggest that many IPOs are “under-priced’ and are likely to increase in value as soon as they trade on the market. However, some IPOs fall and trade below their listing price, and as such, the “issue price” of an IPO, or the price that someone participating in the IPO would pay, is not necessarily the best determinant of value.
There are many other ways to value an IPO however, with many valuation methods ranging from the incredibly simple, to the incredibly complex. Each method has its advantages and disadvantages, but it is worth keeping in mind that no extant model will consistently and accurately predict the fair value of a company. Rather, they provide a facility for comparing different share prices, as well as a gauge of the premium or discount that a stock is currently trading at, relative to its peers.
It should be noted at this point that IPOs are very high risk and this article is not intended as investment advice. Please seek professional financial advice before making any investment decision in any IPO or the companies mentioned in this article.
One of the most common ways of valuing a company is through a discounted cash flow (DCF) or discounted dividend model (DDM). These models are based mostly on the work of John Burr William’s “The Theory of Investment Value”, which holds that the present value of an investment is essentially the sum of future cash flows discounted to today’s value.
There are several variations on the DCF and DDM models, but most of them rely on discounting the predicted cash flows for an explicit forecast period (often something like forecasting the next 5 years or cash flows or dividends). They will then determine a continuing value or terminal value, which is also discounted to a present value.
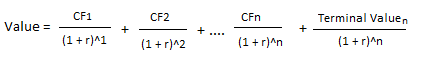
Where:
CF is a company’s cash flow or dividend per period
R is the company’s risk adjusted discount rate
N is the number of periods beyond present (usually calculated per year)
These models rely on the assumption of constant variables. However, in the real world these variables are constantly changing. They also attempt to quantify a market that is based on the forces of supply and demand, which are in turn impacted by sentiment and psychology.
Another way of judging the value of an IPO is to compare its price to earnings ratios to its peers. The two most common of these ratios are the PE (Price / Earnings) and the PEG (Price/Earnings/Growth) ratios.
The PE ratio is calculated: price per share ÷ earnings per share
The PEG ratio is calculated: (price per share ÷ earnings per share) ÷ earnings per share growth
Investors often consider a lower PE or PEG ratio as indicating that a company is undervalued relative to its peers. Similarly, a high PE or PEG ratio is often interpreted to mean that a company is overvalued relative to its peers. These ratios are incredibly simple, which makes them easy to use, but it means that the ratios leave out many important factors in a company’s profitability and share price movements.
Whilst valuation metrics can be useful in determining the relative value of a company, there can be no methodology that is unconditionally accurate. That is because unquantifiable market forces ultimately determine prices.
General Information Only
S3 Consortium Pty Ltd (S3, ‘we’, ‘us’, ‘our’) (CAR No. 433913) is a corporate authorised representative of LeMessurier Securities Pty Ltd (AFSL No. 296877). The information contained in this article is general information and is for informational purposes only. Any advice is general advice only. Any advice contained in this article does not constitute personal advice and S3 has not taken into consideration your personal objectives, financial situation or needs. Please seek your own independent professional advice before making any financial investment decision. Those persons acting upon information contained in this article do so entirely at their own risk.
Conflicts of Interest Notice
S3 and its associated entities may hold investments in companies featured in its articles, including through being paid in the securities of the companies we provide commentary on. We disclose the securities held in relation to a particular company that we provide commentary on. Refer to our Disclosure Policy for information on our self-imposed trading blackouts, hold conditions and de-risking (sell conditions) which seek to mitigate against any potential conflicts of interest.
Publication Notice and Disclaimer
The information contained in this article is current as at the publication date. At the time of publishing, the information contained in this article is based on sources which are available in the public domain that we consider to be reliable, and our own analysis of those sources. The views of the author may not reflect the views of the AFSL holder. Any decision by you to purchase securities in the companies featured in this article should be done so after you have sought your own independent professional advice regarding this information and made your own inquiries as to the validity of any information in this article.
Any forward-looking statements contained in this article are not guarantees or predictions of future performance, and involve known and unknown risks, uncertainties and other factors, many of which are beyond our control, and which may cause actual results or performance of companies featured to differ materially from those expressed in the statements contained in this article. S3 cannot and does not give any assurance that the results or performance expressed or implied by any forward-looking statements contained in this article will actually occur and readers are cautioned not to put undue reliance on forward-looking statements.
This article may include references to our past investing performance. Past performance is not a reliable indicator of our future investing performance.