
Tracking the next disruptors in the graphite industry
Published 28-SEP-2016 14:26 P.M.
|
13 minute read
Hey! Looks like you have stumbled on the section of our website where we have archived articles from our old business model.
In 2019 the original founding team returned to run Next Investors, we changed our business model to only write about stocks we carefully research and are invested in for the long term.
The below articles were written under our previous business model. We have kept these articles online here for your reference.
Our new mission is to build a high performing ASX micro cap investment portfolio and share our research, analysis and investment strategy with our readers.
Click Here to View Latest Articles
It could be argued Magnis Resources (ASX: MNS) is the standout emerging stock in the graphite space given its relatively near-term earnings outlook, substantial high-grade resource and a management team that has executed well in relation to establishing offtake agreements, especially in terms of working with buyers to ensure that it is getting the best out of end markets, and purchasers are getting the product that best suits their needs.
Further evidence of the latter emerged in mid-September when the company updated the market regarding spherical graphite production, along with highlighting an escalation in resources devoted to its lithium-ion battery commercial anode development programs.
The following graphic highlights the points of difference between MNS and its emerging competitors with regard to the basic resource right through to treatment and distribution to end markets.
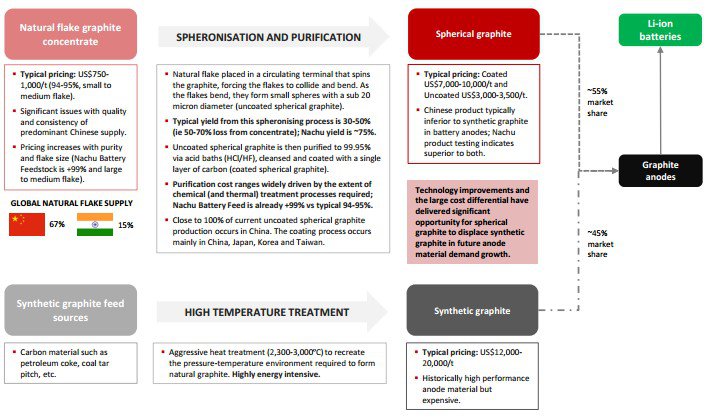
Furthermore, recent commentary by management underlines the fact that Magnis is just as much a niche tech play as a budding graphite producer.
Chief Executive, Dr Frank Houllis said, “Magnis continues to advance both the Nachu graphite project and its spherical graphite strategy in parallel, and the company’s ability to produce a high quality spherical graphite product without the current Chinese process route requiring chemical and thermal purification has the potential to provide Magnis with a significant competitive advantage over existing production and potential new entrants”.
Whether this advantage eventuates is yet to be determined. Investors considering this stock should factor all information about Magnis into their investment equation and seek professional financial advice.
While there is no disputing the quality of MNS’s product or its strategy in terms of bringing its product to market, Finfeed felt it was worth investigating some other stocks that have similarities to MNS and/or have standalone attributes that make them well worth examining. On this note, investors should be attuned to how quickly share prices can run in this space.
Typically they don’t wait until production commences in the mining industry, but it is particularly the case in the emerging metals space that share prices have a habit of running hard well before they get to that stage.
The rise and rise of Magnis
MNS is a good example of how quickly things can unfold if the asset is good enough. As a multi-commodity explorer trading under the name of Uranex, the Nachu project came out of left field in 2013. But even in March of that year it was only assay results from surface outcrop samples that prompted the company to dig a little deeper.
If you want to get a real feel for just how desperate things were for MNS at that stage (even after receiving promising assay results) read the terms of the following $2.1 million capital raising.
In the wake of this lowball capital raising, shares in MNS traded as low as 2.4 cents and it wasn’t until the end of the year when the company was delivering some promising drilling results that there was some material share price traction.
That said, the company’s shares continued to mainly trade in the vicinity of 20 cents until mid-2015. While there were some peaks and troughs, the company’s shares generally traded between 30 cents and 50 cents over the ensuing 12 months.
However, they really took off in 2016 as developments outlined above brought the company under the spotlight. The fact remains though, that the high of $1.12 struck in mid-June makes the stock a near 50 bagger relative to its share price some three years earlier.
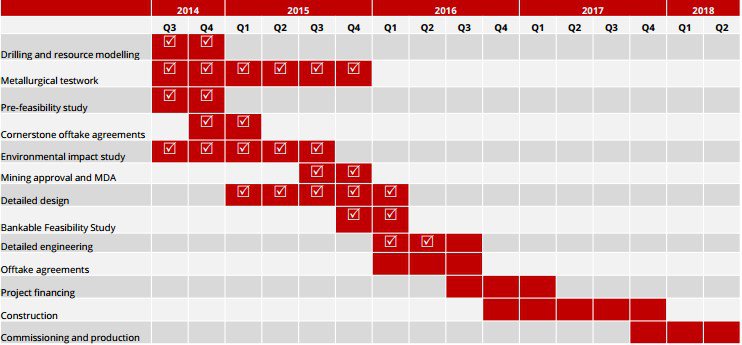
The most significant change over this period has been the fact that the milestones outlined below have been achieved on time and on budget and the projected steps to production are now all the more tangible.
Finding the next Magnis
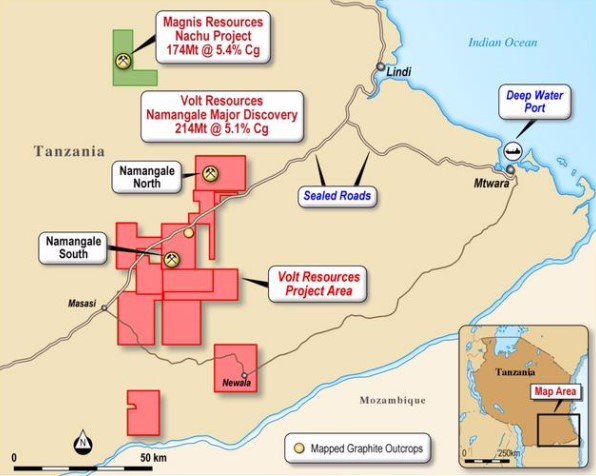
Volt Resources (ASX: VRC) bears many similarities to Magnis, not the least being the fact that its Namangale graphite project is located in Tanzania, not too far to the south of the Nachu project.
It should be noted here that Tanzania getting mining projects up and running in countries such as Tanzania is no simple feat for political and social reasons, and there may be challenges ahead. You need to fully inform yourself of all factors and information relating to this company before engaging with it and seek professional financial advice.
In another interesting twist, VRC appointed former non-executive director of Magnis Resources, Stephen Hunt as executive chairman in February following a short stint as a non-executive director (appointed December 2015).
Hunt was involved in securing the finance and offtake agreements for Magnis, making him an invaluable source of experience as VRC addresses issues such as financing and identifying end markets as it moves towards construction and production.
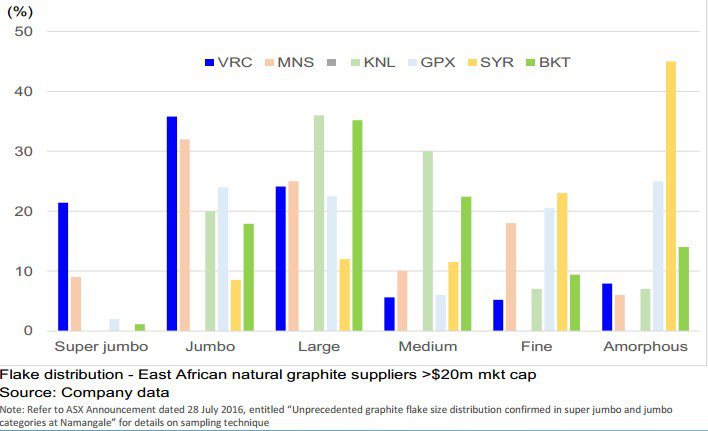
As can be seen below, the quality and size of the resource is also comparable, and importantly more than 50% of VRC’s flake distribution falls into the premium price super jumbo and jumbo categories.
Looking at comparisons, the two companies had similar proportions of jumbo (circa 35%) and large (circa 25%) flake distribution, but VRC is the standout in terms of super jumbo with a distribution of more than 20%. Its closest peer is MNS (less than 10%).
To demonstrate the significance of flake size, VRC recently quoted data from a US-based corporate advisor regarding the estimated 12 to 18 months forward price per tonne.
Based on this data it was established that super jumbo flake would fetch more than US$4000 per tonne and jumbo flake would sell for more than US$2500 per tonne. Imagine a precious or base metal player that could command a premium of more than 50% for its product compared with its peers.
Their asset valuations would be higher, margins generated at the production stage would be substantially more lucrative and these dynamics would without a doubt be reflected in the share price.
More than 80% of VRC’s resource falls into the super jumbo, jumbo and large flake size categories. Even large flake fetches US$1600 per tonne as opposed to US$700 per tonne for small flake.
VRC’s resource also has a high degree of purity with recent graphite concentrate results from Namangale returning grades of up to 99.3% TGC (total graphitic carbon) with +500 micron flake.
Processing did not require industrial chemicals, providing cost advantages over competitors with resources that require more complex processing.
VRC’s product received a tick of approval from Phil Hearse, the Managing Director of BatteryLimits, the consultant undertaking metallurgical testing and coordinating the prefeasibility study.
Hearse said, “These results from Namangale show high-grade course flake graphite that is amongst the best we have seen in our experience with graphite projects, especially since there is still considerable opportunity for further optimisation”.
VRC has already negotiated agreements with four customers, including a 60,000 tonnes per annum order from Optimum Nano, China’s second largest integrated lithium-ion battery producer.
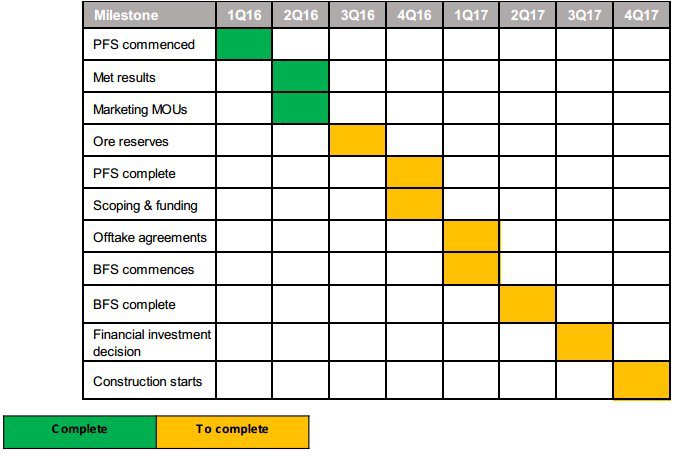
Key milestones over the next 12 months will be the completion of the prefeasibility study and funding (4Q16), completion of the bankable feasibility study (2Q17) and the commencement of construction which is forecast to occur prior to the end of calendar year 2017.
Results of these are still some way off, so if investors are considering Volt for their portfolio they should seek professional financial advice.
From a share price perspective, a retracement from 15 cents in mid-2016 to the current trading range of 9 cents could represent a useful entry point.
Black Rock Mining’s (ASX: BKT) share price speaks for itself with its spike from 2.5 cents only seven months ago to a high of 21.5 cents in August making it a near 10 bagger.
The key early stage catalyst was the establishment of a maiden JORC resource of 131.1 million tonnes grading 7.9% TGC at its Mahenge project, also located in Tanzania. At that stage this was the third largest JORC compliant graphite resource in Africa and the fourth largest globally.
With the mine life estimated at 30 years and the potential to be operated from multiple zones at low strip ratios there is the potential for early payback of capital and scalability.
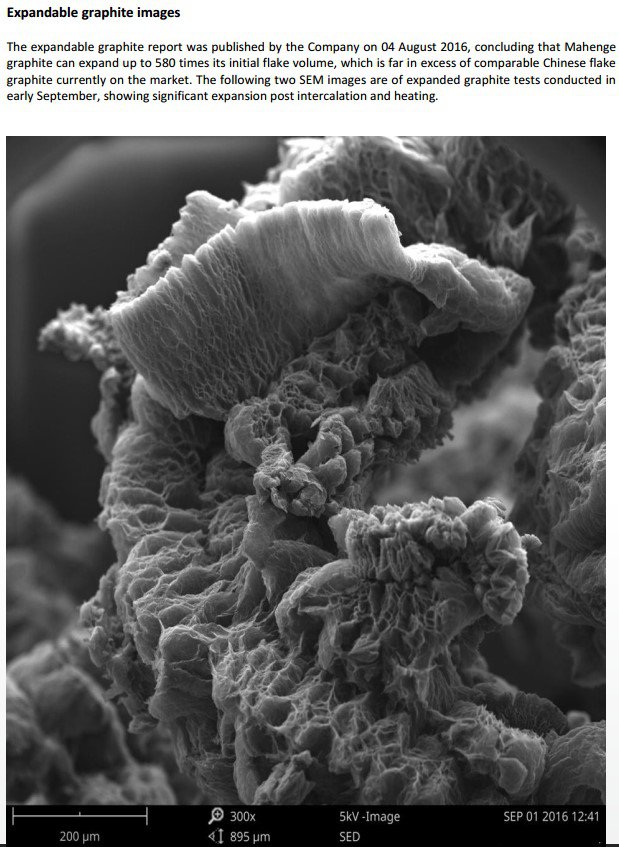
The second catalyst was confirmation that an optimise flotation process applied to primary mineralisation from the project achieved 99% TGC purities. This opened up the potential to manufacture’s spherical graphite free of chemical purification.
On the back of this news the company’s shares spiked nearly three-fold in a matter of days, and surged 50% again in late July after management provided a marketing update following meetings with potential European and Asian offtake partners.
Following discussions BKT’s marketing manager, Robert Sills said, “We are very pleased with initial discussions held with potential offtake groups, and the level of interest in Black Rock Mining’s graphite products across several regions is encouraging, particularly the level of new enquiries following our recent metallurgical results”.
Last week management informed the market that it had manufactured battery grade spherical graphite from 95.86% TGC Mahenge graphite using conventional milling and purification methods.
Up to 99.98% TGC purity was achieved and test work is underway in the US and Japan with new high purity 99.2% TGC concentrates.
The test program which yielded these most recent results was conducted in Europe by an independent test laboratory using the company’s early generation 95.86% bulk concentrates that were sent for evaluation in May 2016, prior to the company achieving higher 99% TGC purity concentrates.
It is expected that the recent TGC concentrates will make higher specifications spherical graphite, and this has prompted management to distribute the high quality battery grade spherical test samples for evaluation to both independent laboratories and graphite end users.
This has the potential to not only confirm that BKT’s product is suitable across various applications, but it could also prove to be a catalyst for end users to approach the company in order to negotiate offtake agreements.
Armadale Capital Plc
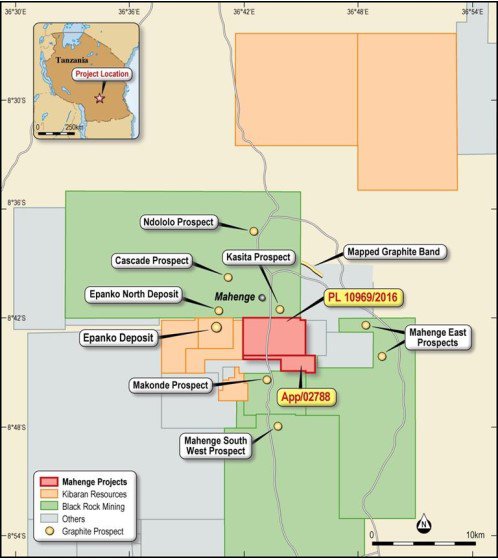
Armadale Capital Plc (LSE: ACP) also has impressive neighbours in close proximity to its Mahenge Liandu graphite project, once again located in Tanzania.
The company’s project is situated only 10 kilometres from the town of Mahenge and lies to the east of Kibaran Resources’ (ASX: KLN) Epanko project which has a proven and probable ore reserve of 10.9 million tonnes at 8.6% TGC. BKT’s project is situated only 1 kilometre north-west of Liandu.
ACP informed the market in August that geological mapping conducted at the Mahenge Liandu graphite project had confirmed extensive areas of graphite mineralisation.
It is worth noting that Kibaran only recently negotiated an offtake agreement with Japanese commodities trader, Sojitz Corporation, for the sale of 14,000 tonnes per year of natural flake graphite.
This brings the total number a binding agreements to 30,000 tonnes, indicating the commercial viability of the resource traditionally found in the Mahenge region.
Consequently, ACPs identification of numerous areas of extensive surface outcrop at Liandu that is well correlated with anomalies identified in electromagnetic survey is an important development.
Should the quality of the resource measure up, the fact that ACP has an extensive strike length of 2.6 kilometres which remains open and a further mineralised zone identified to the west of this project which has a 3.7 kilometre strike length will become significant when early stage number crunching on resource size comes into play.
On the score of quality, rock chip samples taken in June 2016 returned high grade graphite mineralisation of up to 33.8% TGC. Previous drilling has confirmed high-grade mineralisation from the surface with results including 60 metres grading 10.7% TGC.
ACP announced last week that drilling has commenced at the project over a 2 kilometre strike length with approximately 1400 metres of drilling planned. Results are expected in the fourth quarter of 2016 and these will contribute to the development of an initial JORC compliant resource.
ACP Chairman William Frewen underlined the fact that the company had wasted no time in getting the project underway, having only acquired the asset two months prior.
Frewen is not deterred by the fact that some of the company’s peers will be bringing product to market at an earlier stage, saying, “Surging global demand for electric vehicle and power storage utilities are directly driving lithium-ion battery manufacturers to increase output at an accelerated rate and this dynamic creates excellent future opportunities for Armadale Capital, as well as added incentives to expedite progress of the Mahenge Liandu graphite project”.
Magnis draws accolades from Macquarie
Harking back to MNS, while announcements regarding processing procedures never look as flashy as resource upgrades, feasibility studies and offtake agreements they are extremely important in terms of the company’s long-term future and how it is viewed by institutional investors and high profile clients.
Consequently, it wasn’t surprising last week to see Macquarie Wealth Management, one of Australia’s leading brokers, initiate coverage on the stock. It has an outperform recommendation on the company and its 12 month price target of $1.70 is in line with its discounted cash flow valuation.
This implies a premium of circa 100% to the company’s recent trading range. It isn’t difficult to see MNS trading up towards this level sooner rather than later if one considers peer valuations and relative share price performances.
Magnis or Syrah?
While the larger Syrah Resources (ASX: SYR) with a market capitalisation of circa $1.2 billion (MNS: market capitalisation $400 million) is expected to come into production in fiscal 2017, material earnings won’t be recognised until fiscal 2018.
Macquarie is forecasting a fiscal 2018 net profit of $45.7 million, representing earnings per share of 17 cents which implies a PE multiple of 26 relative to Thursday’s closing price of $4.39.
It is worth noting that in the last 12 months Syrah’s share price has increased 180% from $2.39 to a high of $6.66, mainly driven by developments such as offtake agreements and confirmation that the group was on track for commissioning of its Balama project in the first quarter of calendar year 2017.
Macquarie has a price target of $6.60 on the stock. In terms of making a comparison between Syrah and Magnis, fiscal 2019 projections could be viewed as the best way to weigh up the two stocks as this is the year in which SYR significantly ramps up production.
Macquarie is forecasting SYR to generate a net profit of $226 million in fiscal 2019, representing earnings per share of 85.6 cents. This places the company on a PE multiple of 5.1 relative to its current trading range.
Macquarie is forecasting MNS to generate a net profit of $192 million in fiscal 2019, representing earnings per share of 18.3 cents. If SYR’s PE multiple were to be applied to MNS’s projected earnings for fiscal 2019 it would imply a share price of 94 cents, a premium of circa 10% relative to the company’s recent current trading range.
While on face value this may suggest that things are broadly in balance, it doesn’t take into account the fact that MNS is expected to increase production from 177,000 tonnes in fiscal 2019 to 250,000 tonnes in fiscal 2020.
The subsequent earnings increase is substantial with Macquarie forecasting a net profit of $282 million, representing earnings per share of 26.9 cents, implying a PE multiple of 3.2.
This poses the question as to whether MNS, which in broad terms is trailing SYR by about a year in terms of delivering material production, will experience a similar degree of share price upside in the next 12 months as SYR did as it drew closer to production.
Then again, should investors be looking at a fringe player with relatively strong production visibility in Volt Resources on the basis that its share price will go on to replicate the substantial gains made by MNS and SYR?
It should be noted that commodity price projections, earnings forecasts, price targets and past share price performances may not be met or replicated and as such should not be used as the basis for an investment decision. Seek professional financial advice.
General Information Only
S3 Consortium Pty Ltd (S3, ‘we’, ‘us’, ‘our’) (CAR No. 433913) is a corporate authorised representative of LeMessurier Securities Pty Ltd (AFSL No. 296877). The information contained in this article is general information and is for informational purposes only. Any advice is general advice only. Any advice contained in this article does not constitute personal advice and S3 has not taken into consideration your personal objectives, financial situation or needs. Please seek your own independent professional advice before making any financial investment decision. Those persons acting upon information contained in this article do so entirely at their own risk.
Conflicts of Interest Notice
S3 and its associated entities may hold investments in companies featured in its articles, including through being paid in the securities of the companies we provide commentary on. We disclose the securities held in relation to a particular company that we provide commentary on. Refer to our Disclosure Policy for information on our self-imposed trading blackouts, hold conditions and de-risking (sell conditions) which seek to mitigate against any potential conflicts of interest.
Publication Notice and Disclaimer
The information contained in this article is current as at the publication date. At the time of publishing, the information contained in this article is based on sources which are available in the public domain that we consider to be reliable, and our own analysis of those sources. The views of the author may not reflect the views of the AFSL holder. Any decision by you to purchase securities in the companies featured in this article should be done so after you have sought your own independent professional advice regarding this information and made your own inquiries as to the validity of any information in this article.
Any forward-looking statements contained in this article are not guarantees or predictions of future performance, and involve known and unknown risks, uncertainties and other factors, many of which are beyond our control, and which may cause actual results or performance of companies featured to differ materially from those expressed in the statements contained in this article. S3 cannot and does not give any assurance that the results or performance expressed or implied by any forward-looking statements contained in this article will actually occur and readers are cautioned not to put undue reliance on forward-looking statements.
This article may include references to our past investing performance. Past performance is not a reliable indicator of our future investing performance.