
Picking direction is like painting a picture
Published 21-SEP-2016 17:17 P.M.
|
6 minute read
Hey! Looks like you have stumbled on the section of our website where we have archived articles from our old business model.
In 2019 the original founding team returned to run Next Investors, we changed our business model to only write about stocks we carefully research and are invested in for the long term.
The below articles were written under our previous business model. We have kept these articles online here for your reference.
Our new mission is to build a high performing ASX micro cap investment portfolio and share our research, analysis and investment strategy with our readers.
Click Here to View Latest Articles
Picking direction to a trader is what swinging a golf club is to a golfer. It’s not the only factor that determines your success, but good luck teeing off if you can’t writes Karo Cornips, Advisor at Options Educator, TradersCircle.
There are two schools of analysis: Fundamental and Technical. Most traders primarily use technical analysis, and therefore this is the focus of the article.
Picking the right direction is akin to painting a picture. There are many artists with different methods and approaches, just as there are many approaches to picking direction.
Technical analysis is the study of charts and graphs which primarily displays graphically the historical prices and volume of the security. The theory is that studying how a security has acted in the past will give a strong indication of what it is likely to do in the future. Technical analysis can essentially be broken down into three important elements: Trends, Patterns, and Indicators.
As these steps are applied, a picture is painted of the stock, and by the end of it, that picture may show which way the security is likely to go in the future.
Trend lines are the basis of technical analysis. They are like the lines and shapes of the painting. They show the direction of a stock over a certain period of time. The idea is to connect multiple peaks or troughs to project where the security may trade to in the future.
Trends are drawn over specific periods of time. Therefore multiple trends may appear when analysing a security.
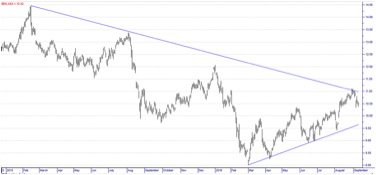
For example, the long blue line on the chart below indicates a down trend line on Bendigo and Adelaide bank (BEN). The short green line is another trend line from a shorter time period. It may also be called a counter trend line because it goes against the overall trend. The chart shows that BEN may be in a downtrend over a long period of time, but since March has been rising.
Support and Resistance lines
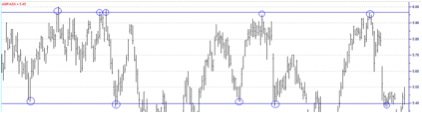
Support or Resistance lines are created at a price point in which the stock hits, and then reverses from. Support is found below the current share price, and Resistance above. They provide an indication to where the security may head to, further painting the picture. Like trend lines, there can be multiple levels of support or resistance to consider. It’s important to note that Trend lines are also essentially support and resistance lines, but with a gradient. The chart below of AMP Limited (AMP) shows both a Resistance and Support level represented as blue lines. They are particularly strong levels because both have several points where they have forced the AMP to reverse, shown by the blue circles.
Patterns
Most patterns are what appear when we use trend, support, and resistance lines in conjunction with one another. Patterns are like the images that appear in painting giving it meaning to the viewer. Once a pattern is formed it is much easier to discern the future movement of the security. There are many different types of patterns; two popular types are triangle and channel patterns.
Triangle Patterns
Triangle patterns come about with the converging of trend and counter trend lines, or trend and support or resistance lines. When a security breaks out of a triangle pattern, often it continues in the direction of the break for a number of days. Recognising breaks is a powerful skill for predicting future price movements.
The chart of CBA below, shows a down trend line and a strong level of support. This is called a Descending Triangle and is a type of triangle pattern. The share price has also just broken out of that triangle by breaking the down trend line.
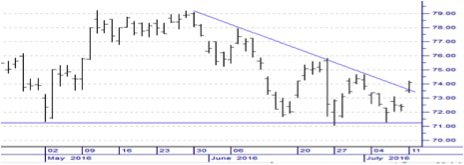
As the chart shows, CBA continued in the direction of the break for 13 days making powerful gains.
Channel Patterns
Channel patterns are born from trend, support or resistance lines that are parallel. Like triangle patterns, they appear in different forms, and when a security trades within them or breaks them, trading opportunities are presented.
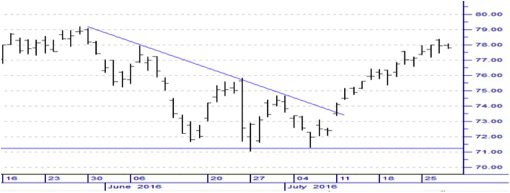
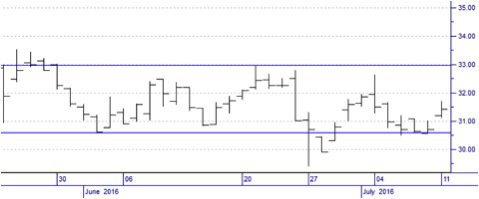
For example, the chart below shows a channel pattern on Flight Centre Travel Group Ltd (FLT). The stock has traded between two strong levels of support or resistance for quite some time, and just bounced off support. The conclusion is that FLT will continue higher back towards resistance.
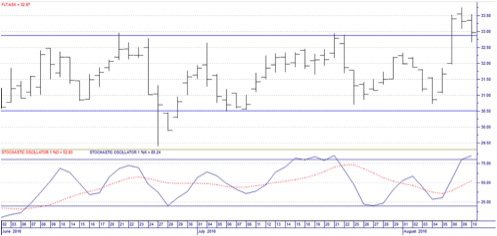
Below shows that FLT continued to trade within the channel. Once it finally broke, it continued to travel in the direction of the break, creating further trading opportunities.
Indicators
Indicators are the final touches of the painting. They are the shadowing and final detail that brings the painting to life. They are graphical representations of mathematical calculations based on price history and/or volume of the security. There are a plethora of indicators that traders use, and they are mostly used as confirmation tools. It is important to note that using too many indicators can often give conflicting opinions, so much so it can to lead to ‘analysis paralyses’.
Stochastic
The Stochastic are a type of oscillator (a broader group of indicators). Oscillators compare the price from an earlier time with today’s price. They are particularly useful in giving trading signals in sideways or consolidating markets.
The Stochastic oscillator is used to estimate the likelihood that a stock is overbought or oversold, and therefore due for a change in direction. In addition, where they are pointing helps indicate which direction the security is likely to go.
The Stochastic is composed of two elements; the dotted line (red) and the solid line (blue).
When these lines cross, it can be a strong indication that the stock is going to, or has experienced, a change in direction. This is a particularly useful confirmation tool when used in conjunction with other analysis.
Using the same FLT example, you can see that the blue line goes with the direction of the stock and the crossovers of the blue and red lines reflect the change in the direction of the stock.
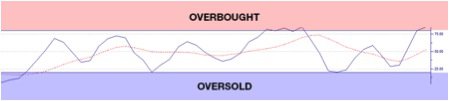
Finally, the stochastic have one other important element. The stochastic area is separated into neutral, overbought, and oversold areas. The overbought and oversold areas are above the top horizontal line and bottom horizontal line receptively. When the stochastic are pointing down and coming out of the overbought area, it’s a strong indication that the stock will fall and return to fair value. Equally, if the stochastic are coming out of the oversold area and pointing up, it’s a strong indication that the stock will rise and return to fair value.
No one can ultimately know the direction of a security or market, but once a trader has become a virtuoso in technical analysis, they are equipped with a skill necessary to profit from the market. Using trend lines, patterns, and indicators, it is possible to predict the future. To do so consistently requires experience and the knowledge to use these skills effectively.
Having a structured approach to using technical analysis is important, as is learning from a professional. TradersCircle runs courses and programs on technical analysis to equip its clients with not only the knowledge but also the experience every trader needs in order to pick the right direction.
General Information Only
S3 Consortium Pty Ltd (S3, ‘we’, ‘us’, ‘our’) (CAR No. 433913) is a corporate authorised representative of LeMessurier Securities Pty Ltd (AFSL No. 296877). The information contained in this article is general information and is for informational purposes only. Any advice is general advice only. Any advice contained in this article does not constitute personal advice and S3 has not taken into consideration your personal objectives, financial situation or needs. Please seek your own independent professional advice before making any financial investment decision. Those persons acting upon information contained in this article do so entirely at their own risk.
Conflicts of Interest Notice
S3 and its associated entities may hold investments in companies featured in its articles, including through being paid in the securities of the companies we provide commentary on. We disclose the securities held in relation to a particular company that we provide commentary on. Refer to our Disclosure Policy for information on our self-imposed trading blackouts, hold conditions and de-risking (sell conditions) which seek to mitigate against any potential conflicts of interest.
Publication Notice and Disclaimer
The information contained in this article is current as at the publication date. At the time of publishing, the information contained in this article is based on sources which are available in the public domain that we consider to be reliable, and our own analysis of those sources. The views of the author may not reflect the views of the AFSL holder. Any decision by you to purchase securities in the companies featured in this article should be done so after you have sought your own independent professional advice regarding this information and made your own inquiries as to the validity of any information in this article.
Any forward-looking statements contained in this article are not guarantees or predictions of future performance, and involve known and unknown risks, uncertainties and other factors, many of which are beyond our control, and which may cause actual results or performance of companies featured to differ materially from those expressed in the statements contained in this article. S3 cannot and does not give any assurance that the results or performance expressed or implied by any forward-looking statements contained in this article will actually occur and readers are cautioned not to put undue reliance on forward-looking statements.
This article may include references to our past investing performance. Past performance is not a reliable indicator of our future investing performance.