Could NCM be settling in for a long rally?
Published 09-FEB-2017 12:31 P.M.
|
5 minute read
Hey! Looks like you have stumbled on the section of our website where we have archived articles from our old business model.
In 2019 the original founding team returned to run Next Investors, we changed our business model to only write about stocks we carefully research and are invested in for the long term.
The below articles were written under our previous business model. We have kept these articles online here for your reference.
Our new mission is to build a high performing ASX micro cap investment portfolio and share our research, analysis and investment strategy with our readers.
Click Here to View Latest Articles
Newcrest Mining (ASX: NCM), the go to gold stock of Aussie investors, has returned some impressive gains in the past few months.
After hitting a high of more than $26 per share in July last year, the stock lost 37% of its value to fall as low as $16.75 on December 16.
Then NCM rallied hard, returning loyal shareholders a handy 41% since its mid-December slump.
It should be noted that share trading patterns should not be used as the basis for an investment as they may or may not be replicated. Those considering this stock should seek independent financial advice.
Those type of gains, in such a short amount of time, are what you might expect from a small cap explorer – not from Australia’s largest gold producer. And with a market cap of $17.6 billion, NCM is in fact one of the largest gold miners in the world.
So what made the share price take off?
NCM has rallied 10% since the start of this month alone. This leap followed some good news from the company when it reported its quarterly results on January 31. Both production numbers and the company’s costs came in better than what was expected.
But that is just a small piece of a bigger story. As a gold producer, the major factor for NCM has been a sharp rally in the gold price.
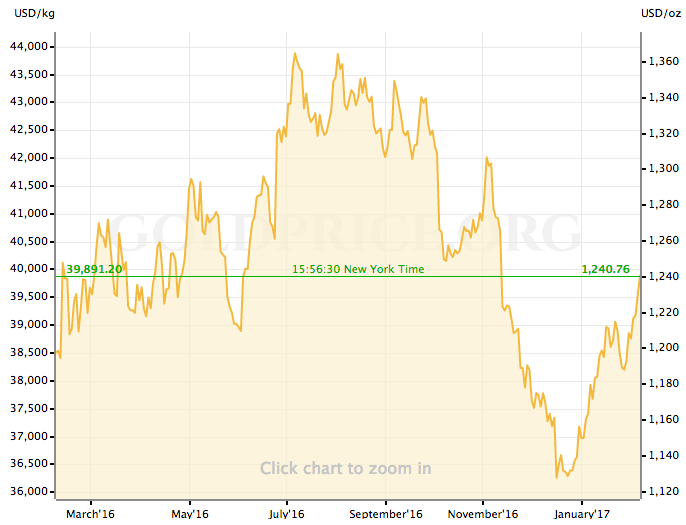
Here’s the gold spot price over the past year:

It should be noted that commodity prices do fluctuate and caution should be applied to any investment decision here and not be based on spot prices alone. Seek professional financial advice before choosing to invest.
The gold price has risen since December last year for a number of reasons and it has pulled NCM up with it.
But while it has risen sharply since mid-December, the gold price is only up 11% in that time, compared to a 41% rise by NCM.
That’s because it is not only actual movements in the gold price that encourage investors to buy gold stocks, but also the expectation that gold will climb higher still.
Gold is rising because it is considered to be a safe haven investment. That means when the markets look a bit shaky or there’s fear in the air, investors will lock away their cash in gold until the air clears.
The US Federal Reserve has failed to reassure markets, when at its monthly meeting on February 1, it gave no clear indication around whether it would raise rates in March. Investors are now doubting whether the Fed will honour of its pledge of three rate rises this year.
When interest rates rise, or are even just anticipated to rise, the investors choose higher yielding investments over gold, which pushes the gold price lower.
Low interest rates in the US also keep the US dollar low because foreign investors choose to send their cash to higher yielding markets where they can earn a superior return.
What that means for gold is that when the US dollar falls, or even if it doesn’t rise when it is expected to, gold becomes cheaper for foreign buyers. This drives demand and sends the gold price higher.
Gold is also a winner in times of uncertainty and there’s no doubt that the arrival of Trump in the Whitehouse has brought with it a global feeling of uncertainty.
Hostile relations with other world leaders have been brought about by Trump’s immigration ban, his trade protectionism stance, accusations that China is intentionally devaluing its currency, and his general combative attitude.
The uncertainty around how his presidency will play out and the fear it has brought to investment markets is a boon for gold. And as you can see in the chart above, the gold price has now risen above its previously strong and psychologically important technical resistance level of $1,220 per ounce.
The question now is can NCM keep rallying back to the lofty highs of 2011, when it traded about $40 per share?
For one, the charts say yes.
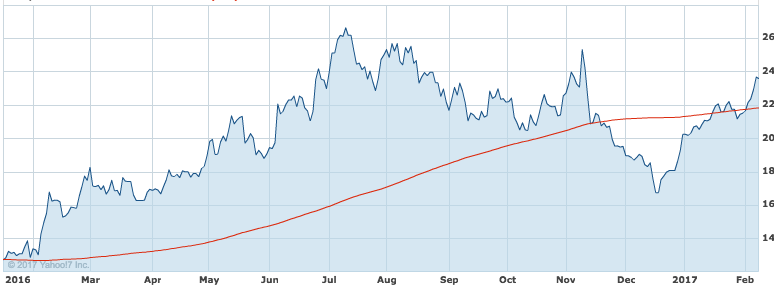
Take a look at this chart of Newcrest from YahooFinance:

It should be noted that historical data in terms of earnings performance and/or share trading patterns should not be used as the basis for an investment as they may or may not be replicated. Those considering stocks in these markets should seek independent financial advice.
The red line is the 200-day moving average – a simple yet powerful tool for investors. The line is created by taking the average share price each day of the previous 200 trading days to create smoothed price trend.
On the first day of February, NCM moved above its 200-day moving average. This is strong sign that the stock will continue its rise.
When it comes to stock charts, a move above the 200-day average is often regarded as the ultimate buy signal. In fact, there are entire investment portfolios based on that one technical indicator.
One tip to keep in mind if you are thinking of using a strategy such as this yourself, whether it be for NCM or another investment, is to make sure that you are consistent. The biggest downfall of any wannabe trader using chart patterns, is jumping willy-nilly from one indicator to another. It can be tempting to look to other indicators that support a particular bias towards the stock but this is a recipe for failure.
NCM wasn’t always the dominant player that it is today.
The miner comes from humble beginnings, when in 1966 the company was formed and began to explore for gold. Nine years later it developed its first open pit mine. After another 12 years it listed on the ASX and gained over 500% at its peak.
Savvy investors would be wise to question whether NCM’s recent success and bright future is its alone, or are there other gold stocks set to return gains like those seen from the market’s leader.
One small-cap gold stock that’s worth taking a closer look at is Navarre Minerals (ASX: NML). The junior gold explorer updated the market in January with news that drilling at its Stawell Corridor Gold Project in Western Victoria has revealed impressive grades. NML’s exploration is still at a very early stage, but substantial news flow is expected this year as exploration activities progress.
It should be noted that those considering this stock shouldn’t make assumptions regarding exploration outcomes, nor should they base investment decisions on performances to date.
There are a number of junior explorers such as NML that are positioning themselves to leverage off the gold wave. It’s certainly worth your while to take a look.
General Information Only
S3 Consortium Pty Ltd (S3, ‘we’, ‘us’, ‘our’) (CAR No. 433913) is a corporate authorised representative of LeMessurier Securities Pty Ltd (AFSL No. 296877). The information contained in this article is general information and is for informational purposes only. Any advice is general advice only. Any advice contained in this article does not constitute personal advice and S3 has not taken into consideration your personal objectives, financial situation or needs. Please seek your own independent professional advice before making any financial investment decision. Those persons acting upon information contained in this article do so entirely at their own risk.
Conflicts of Interest Notice
S3 and its associated entities may hold investments in companies featured in its articles, including through being paid in the securities of the companies we provide commentary on. We disclose the securities held in relation to a particular company that we provide commentary on. Refer to our Disclosure Policy for information on our self-imposed trading blackouts, hold conditions and de-risking (sell conditions) which seek to mitigate against any potential conflicts of interest.
Publication Notice and Disclaimer
The information contained in this article is current as at the publication date. At the time of publishing, the information contained in this article is based on sources which are available in the public domain that we consider to be reliable, and our own analysis of those sources. The views of the author may not reflect the views of the AFSL holder. Any decision by you to purchase securities in the companies featured in this article should be done so after you have sought your own independent professional advice regarding this information and made your own inquiries as to the validity of any information in this article.
Any forward-looking statements contained in this article are not guarantees or predictions of future performance, and involve known and unknown risks, uncertainties and other factors, many of which are beyond our control, and which may cause actual results or performance of companies featured to differ materially from those expressed in the statements contained in this article. S3 cannot and does not give any assurance that the results or performance expressed or implied by any forward-looking statements contained in this article will actually occur and readers are cautioned not to put undue reliance on forward-looking statements.
This article may include references to our past investing performance. Past performance is not a reliable indicator of our future investing performance.
