
Look beyond the gold price when investing in the sector
Published 04-AUG-2020 12:14 P.M.
|
8 minute read
Hey! Looks like you have stumbled on the section of our website where we have archived articles from our old business model.
In 2019 the original founding team returned to run Next Investors, we changed our business model to only write about stocks we carefully research and are invested in for the long term.
The below articles were written under our previous business model. We have kept these articles online here for your reference.
Our new mission is to build a high performing ASX micro cap investment portfolio and share our research, analysis and investment strategy with our readers.
Click Here to View Latest Articles
The old saying, ‘’a rising tide lifts all boats’’ certainly applies to the gold sector at the moment with the share prices of most companies with any type of exposure experiencing forward momentum.
However, the gold industry is very complex with numerous metrics outside of the gold price impacting earnings.
And when the rubber hits the road, it will be ‘earnings’, not the gold price that will determine what value is attributed to the company, which will in turn be reflected in its share price.
Even exploration companies that haven’t produced an ounce of the precious metal have run on the back of the rampaging gold price.
The exceptional share price surges accelerated in 2020, but as the following chart demonstrates there was a significant step-change in the gold price in July as it broke above US$1800 per ounce to surpass US$2000 per ounce on 31 July for the first time in history, and it continues to trade around that level.
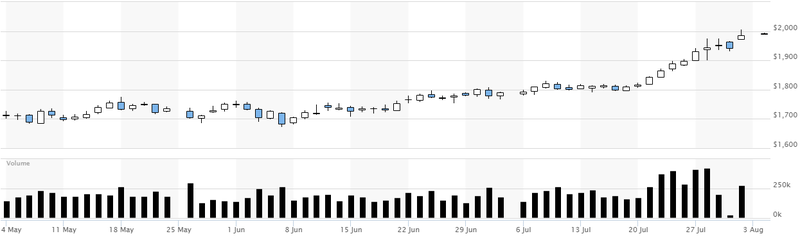
This could be justified, particularly for those that are approaching maiden production.
In fact, there are circumstances where the metrics we will discuss work in favour of the newcomers, arguably making them a better investment prospect than established players in the sector.
While there are several factors that feed into a gold company’s profitability and intrinsic value, in a sense the financial performance comes back to the basic metrics that apply to any company - in simple terms, revenue - costs = profit.
Australian miners a particularly in favour because of the foreign exchange benefits with the Australian dollar currently fetching approximately US$0.71.
The following year to date chart takes into account both the gold price and the AUD:USD exchange rate fluctuations, showing that the Australian dollar gold price has recently hit an all-time high of $2783 per ounce, and it continues to hold around that level.
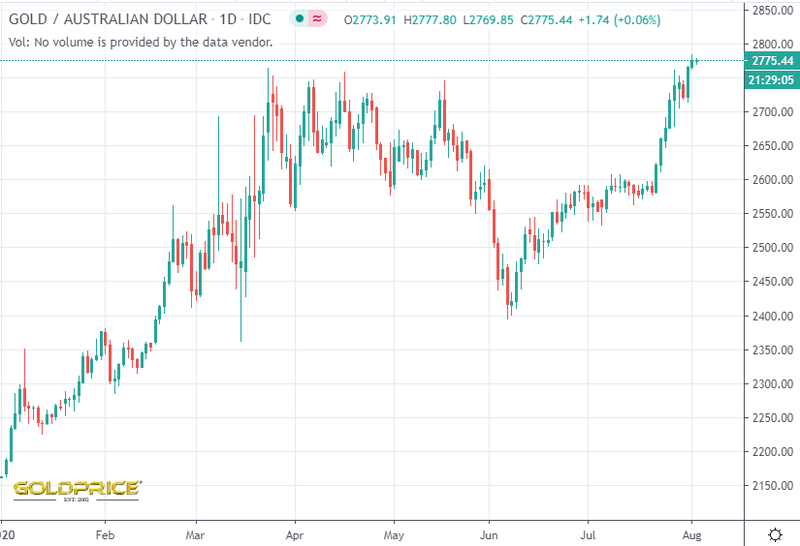
This chart also explains why Australian gold stocks have run so strongly for most of the year.
If you look back to March/April you will see that the depreciating Australian dollar around that period resulted in the Australian dollar gold price pushing up close to current levels.
In fact, on March 24 the Australian dollar gold price hit a high of $2764 per ounce, just shy of its current level.
Income, costs and the bottom-line
The terminology you will often come across when examining mining company reports is all in sustaining costs (AISC).
These are the costs incurred in producing the end product and are completely divorced from the capital costs that relate to the upfront plant and facilities construction and development.
The latter comes into play at a stage when companies are considering the economic viability of projects and you will see the associated costs built into pre-feasibility and bankable feasibility studies which are the precursor to making a decision to mine and obtaining finance.
It is around this time that companies will make decisions regarding raising capital, debt funding, offtake agreements and possible joint ventures.
Once companies are in production, the AISC component of the equation is just as important as commodity prices, tonnes produced and revenues generated.
In fact, commodity prices can be of little significance in many occasions, a factor that is often hidden in the fine print when it comes to updating investors.
Day to day outgoings once the mine is constructed and infrastructure such as processing plants and camp accommodation and facilities are built are relatively easy to determine.
There are expenditure items such as heavy duty equipment repair and replacement, but many mining companies outsource the heavy lifting type work to specialists in that field, obviously at a cost.
Wages are a significant component of costs as are the materials used in the processing and waste treatment phases.
Because many mining sites are in remote areas there is often the need to establish a fly in-fly out (FIFO) employment system which involves significant transport costs.
Utility costs such as power and water can also be elevated in remote areas.
Consumables such as chemicals for the treatment of waste, and other waste management services also come under the AISC banner.
Consequently, these are factors that can have a significant impact on earnings once they have been deducted from production revenues.
From a broader perspective, operating an underground mine will often be more expensive than an open pit operation, but the attraction in going deeper usually relates to accessing larger quantities of ore and/or higher grade mineralisation.
When is the gold price, not the gold price - most of the time
Many companies to varying extents forward sell (hedge) commodities including gold with a view to locking in prices that they see as either a safety net or perhaps better than what will be the prevailing price at a particular date in the future when planned production is ready for sale.
It is unlikely that any gold company would have hedged at US$2000 per ounce 12 months ago when the precious metal was trading around US$1500 per ounce.
Consequently, when gold companies report their results this month if you take a look at the average price realised it will be significantly below US$2000 per ounce, and quite possibly even be shy of US$1500 per ounce.
Based on a gold price of US$2000 per ounce and the current Australian dollar foreign exchange rate of approximately US$0.71, the Australian dollar gold price is approximately $2800 per ounce as shown on the above chart.
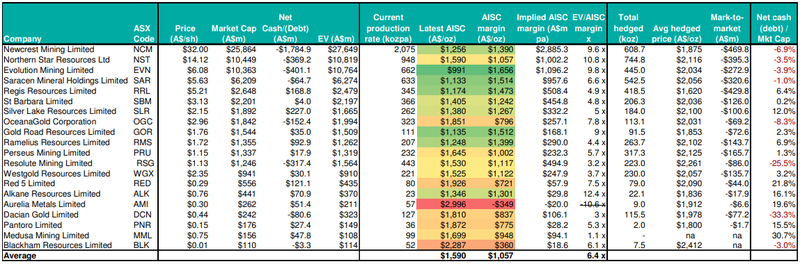
The following table was compiled by analysts at Bell Potter in late May when the Australian dollar gold price was $2647 per ounce.
Margins can be a make or break factor
The implied AISC margin column as shown in the above table tells part of the story as to how much money the company is making for every ounce of gold produced based on the prevailing gold price at that time of $2647 per ounce.
For the best part, this separates mines with high costs of production and low costs of production with the latter normally favoured because of the much better margins and also the safety net of not having margins substantially impacted by negative movements in the gold price.
On that note, history has shown us that significant negative movements in commodity prices have even led to mine closures as the price falls below the costs of production.
You also need to look at another column that provides information regarding hedging (averaged hedged price) to get the true story.
After all, of what benefit is a booming commodity price if you have already forward sold your gold at a much cheaper price.
Use production data to put hedging into perspective
You will notice that column features hedged prices ranging between $1620 per ounce and $2412 per ounce, with the latter only having 7500 ounces hedged.
The average price is around $2000 per ounce ($800 shy of the current spot price), and as indicated in the ‘latest AISC A$/oz’ column, the average AISC is $1590 per ounce, implying a margin of approximately $400 per ounce.
What the number crunchers do is take into account the total hedged ounces, as well as the current and anticipated yearly production in order to assess how long it will be until companies will be able to take advantage of the strong spot price.
They will also be assessing forward earnings outlooks for companies that are well-positioned to take advantage of hedging at a much higher price in the current environment.
One company that stands out to me is Saracen Mineral Holdings (ASX: SAR) which is producing at a rate of 633,000 ounces per annum.
Not taking into account the actual date of forward hedging contracts, SAR can fulfil its hedging with less than 12 months of production, leaving it well-positioned to sell into a strong spot market and/or negotiate new hedging at much higher levels, an initiative that theoretically should boost near to medium-term earnings growth.
As the following chart demonstrates, Saracen (+57.7%) has substantially outperformed the S&P/ASX All Ordinaries Gold Index (+33.3%) over the last six months, and the metrics we discuss here have no doubt come into play in terms of investor support.
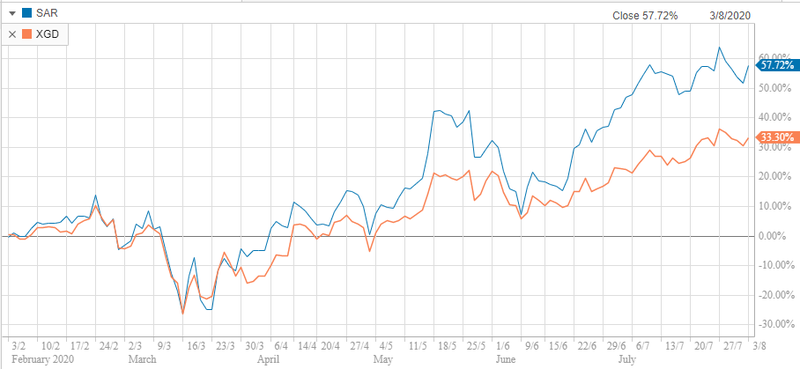
The other factor to take into account is Saracen’s very economical AISC of $1133 per ounce, well below the average of $1590 per ounce.
You will see this is reflected in its AISC margin of $1514 per ounce, which based on the current gold price would be more like $1650 per ounce.
However, this has just scratched the surface as there is one other key strategy that can be employed to substantially drive down costs of production.
Tomorrow we will outline how this has impacted a big player in Newcrest Mining before examining a number of emerging players such as ASX: AQD, ASX: CRL, ASX: HCH, ASX: NML, ASX: PXX, ASX: SPQ, ASX: SVD and ASX: TTM that are positioned to take advantage of adopting a similar strategy.
General Information Only
S3 Consortium Pty Ltd (S3, ‘we’, ‘us’, ‘our’) (CAR No. 433913) is a corporate authorised representative of LeMessurier Securities Pty Ltd (AFSL No. 296877). The information contained in this article is general information and is for informational purposes only. Any advice is general advice only. Any advice contained in this article does not constitute personal advice and S3 has not taken into consideration your personal objectives, financial situation or needs. Please seek your own independent professional advice before making any financial investment decision. Those persons acting upon information contained in this article do so entirely at their own risk.
Conflicts of Interest Notice
S3 and its associated entities may hold investments in companies featured in its articles, including through being paid in the securities of the companies we provide commentary on. We disclose the securities held in relation to a particular company that we provide commentary on. Refer to our Disclosure Policy for information on our self-imposed trading blackouts, hold conditions and de-risking (sell conditions) which seek to mitigate against any potential conflicts of interest.
Publication Notice and Disclaimer
The information contained in this article is current as at the publication date. At the time of publishing, the information contained in this article is based on sources which are available in the public domain that we consider to be reliable, and our own analysis of those sources. The views of the author may not reflect the views of the AFSL holder. Any decision by you to purchase securities in the companies featured in this article should be done so after you have sought your own independent professional advice regarding this information and made your own inquiries as to the validity of any information in this article.
Any forward-looking statements contained in this article are not guarantees or predictions of future performance, and involve known and unknown risks, uncertainties and other factors, many of which are beyond our control, and which may cause actual results or performance of companies featured to differ materially from those expressed in the statements contained in this article. S3 cannot and does not give any assurance that the results or performance expressed or implied by any forward-looking statements contained in this article will actually occur and readers are cautioned not to put undue reliance on forward-looking statements.
This article may include references to our past investing performance. Past performance is not a reliable indicator of our future investing performance.