
Investors transition from expensive blue chips to oversold small caps
Published 05-JUN-2017 15:31 P.M.
|
11 minute read
Hey! Looks like you have stumbled on the section of our website where we have archived articles from our old business model.
In 2019 the original founding team returned to run Next Investors, we changed our business model to only write about stocks we carefully research and are invested in for the long term.
The below articles were written under our previous business model. We have kept these articles online here for your reference.
Our new mission is to build a high performing ASX micro cap investment portfolio and share our research, analysis and investment strategy with our readers.
Click Here to View Latest Articles
Based on the performance of the S&P/ASX All Ordinaries Index (XAO) the Australian sharemarket has tread water in the last three months. The close on Wednesday, May 31 of 5761 points was exactly the same as the close on February 28, 2017.
This means that all the optimism surrounding a break through the psychological 6000 point mark that surfaced when the index peaked at 5983 points in April has dissipated.
While this makes for fairly boring subject matter, looking below the surface at index trends indicates there hasn’t necessarily been money flowing out of the market but a reallocation of funds, interestingly into the small caps space.
The emergence of this trend was flagged by analysts at Macquarie in late May when they said, “We think the market is at an inflection point that will drive a more sustained period of growth stock outperformance, and in turn begin to arrest the underperformance of small and mid-cap stocks vis-a-vis large caps.”
Whether this is a correct assumption or not remains to be seen and investors should tread carefully.
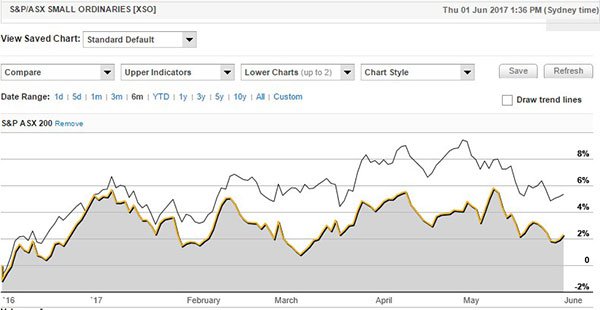
The charts tell the story. As can be seen in the following six-month chart, the S&P/ASX 200 (XJO), home to all the blue-chip companies was outperforming the S&P/ASX Small Ordinaries index (XSO) – yellow line.
May sees an acceleration in the transition to small caps
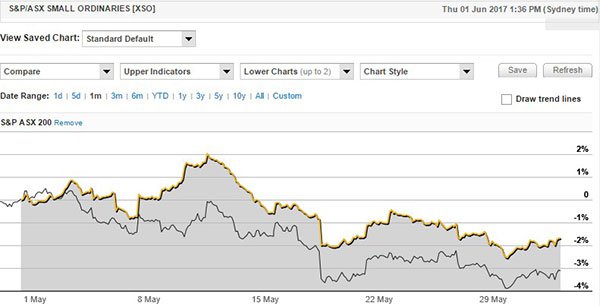
However, the tables started to turn towards the end of the first quarter, and a chart of the three months to May shows that the two indices were on a par. The trend has since strengthened with the following chart demonstrating a distinct outperformance by the XSO since early May.
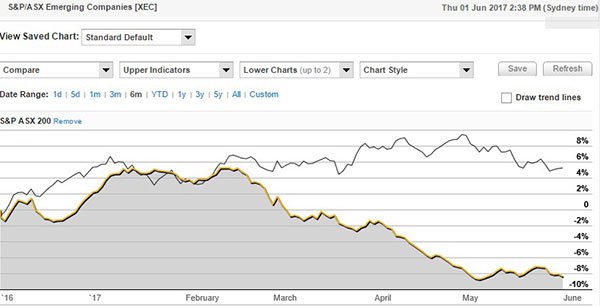
Even more telling evidence of a shift into smaller stocks can be seen by comparing the XJO with the S&P/ASX Emerging Companies Index (XEC) which includes companies with lower market capitalisations than the XSO.
In terms of ASX criteria, the index consists of 200 Australian microcap companies ranked between 350 to 600 by dollar value market capitalisation at the time of their index inclusion that have met reasonable liquidity tests.
Arguably, these are far more speculative, but because they tend to be under-researched and sit outside the major indices which institutional funds are mandated to invest in, there is the potential to identify stocks that are trading well below their inherent value.
This is also an index where stocks can be found that are on the verge of entering a phase of relatively rapid growth, often new companies making the transition to maiden profitability.
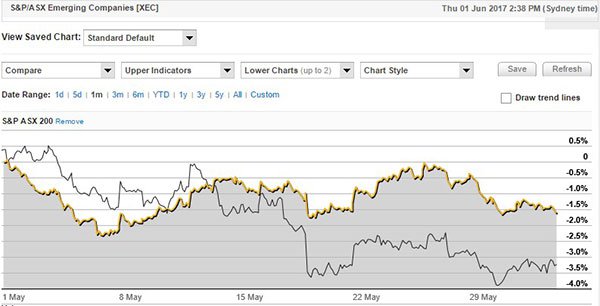
The first chart shows the notable outperformance of the ASX 200 against the XEC (yellow line), while the second chart clearly demonstrates the significant shift that has occurred in the last month with the latter not only outperforming the ASX 200, but substantially extending the margin of outperformance in the last two weeks of May.
Six months to May 31, 2017
One month to May 31, 2017.
The past performance of the indices in this article are not and should not be taken as an indication of future performance. Caution should be exercised in assessing past performance. This product, like all other financial products, is subject to market forces and unpredictable events that may adversely affect future performance.
It is one thing identifying broader trends, but in a stock pickers market it comes back to finding those hidden gems. On this note, it is helpful to access the data which points to the sectors where the stocks are located.
The following pie chart demonstrates the heavy weighting of the Materials and Information Technology sectors which account for 37% of the stocks. Another prominent index is Health Care, accounting for 10.7% of the stocks in the XEC.
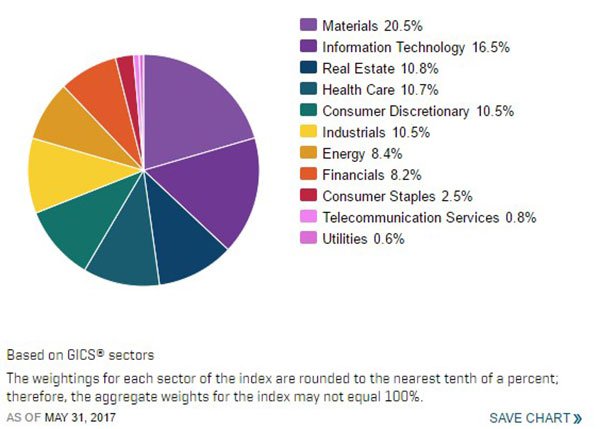
Three sectors dictate XEC
This tells us that close to half of the companies deemed by the ASX on balance to provide investors with exposure to good quality emerging stocks can be found in three sectors.
The Materials sector predominantly covers mining stocks, but can also be home to companies that produce building materials such as bricks and concrete. However, for the best part this area is dominated by big players such as Boral, James Hardie and Adelaide Brighton.
Looking at the stocks in the index, it is generally a mix of base and precious metal explorers and producers with some of the smaller constituents having market capitalisations in the order of $100 million.
It is a similar story amongst the Health Care stocks with most having market capitalisations slightly above $100 million, but there are some exceptions such as OBJ which is capped at circa $90 million.
Rhipe was the smallest IT stock as at the end of May with a market capitalisation of $50 million. It is similar to OBJ in terms of seemingly being on the fringe of transitioning into a consistently profitable enterprise.
Looking across the board, 30 companies in the index had market capitalisations of less than $100 million as at May 31, 2017.
Shift to smallcaps, particularly mining, IT and health evident in Finfeed’s universe of stocks
The top five stocks by share price appreciation that feature in finfeed.com’s universe of companies covered during the three months to May 31, 2017 all fall into the health and mining sectors.
Consistent with the outperformance of revenue generating stocks represented in the XEC, the top performer Immuron (ASX: IMC) delivered the best share price return of 69.5%.
As well as having highly promising drugs in the advanced stage of development in the high profile immunotherapy market segment, IMC currently generates revenues from the distribution of Travelan, the drug it developed for travellers’ diarrhoea.
The company noted on Friday that sales for the 10 months to April 30, 2017 were up 13% compared with the previous corresponding period. Importantly, there is currently strong support for the use of non-antibiotic treatments for travellers’ diarrhoea, a trend that should work in favour of Travelan.
The company’s share price has the potential to undergo a significant rerating should Phase II clinical trials of its IMM-124E drug, which during trials has showed significant effects across all levels of colitis treatment, prove successful. These include clinical parameters, tissue level parameters and immunological biomarkers.
However, anything can happen in this market and the stock remains speculative, so investors should seek professional financial advice if considering it for their portfolio.
Colitis which mainly consists of Ulcerative Colitis and Crohn’s Disease is a chronic and often debilitating group of inflammatory bowel diseases that affect millions of people worldwide. The worldwide market for inflammatory bowel disease is expected to reach US$10 billion by 2021, characterised by a high level of unmet need.
Creso Pharma (+39.5%)
In terms of focusing on companies that are generating revenue from their operations, Creso Pharma (ASX: CPH) is another case in point with the group recently having negotiated distribution agreements for the sale of medical cannabis in Australia, New Zealand, China, Brazil, Chile, Colombia and Mexico.
CPH also fits into the health and biotech sector, and last week’s announcement that it had signed a binding Letter of Intent with Swiss-based producer of certified medicinal cannabis, Cannapharm to strengthen its distribution capacity resulted in its shares increasing from 39.5 cents on the previous day to close the week at 49 cents, representing an increase of circa 25%.
They also traded strongly on Monday morning, hitting a high of 67 cents in the first hour of trading, representing an increase of 37% relative to Friday’s closing price.
It should be noted that share trading patterns should not be used as the basis for an investment as they may or may not be replicated. Those considering this stock should seek independent financial advice.
The Cannapharm agreement is an important one as it allows the company to capitalise on first mover advantages in being the exclusive distributor of highest quality Swiss grade medicinal cannabis products into Asia-Pacific and Latin American markets.
While the initial agreement covers seven countries in those regions, management said it can be expanded to other countries or regions in a partnership that will further enhance CPH’s market leadership position in the rapidly growing industry.
Is also worth noting that CPH has an established agreement with Health House International, an Australian based group which was granted a federal import license after the Federal Government authorised the importation of medical cannabis with the first delivery being received in May.
Prairie Mining (+23.4%)
Coming in at number three was emerging coal producer Prairie Mining (ASX: PDZ), which delivered a three month gain of 23.4%. The company’s shares surged in the latter half of May as investors gained an appreciation of the promise that lies in the company’s Jan Karski semi-soft coking coal project, particularly in relation to the quality of coal contained within the deposit.
Again, these share trading patterns should not be used as the basis for an investment. Those considering this stock should seek independent financial advice.
Management confirmed that a high-value ultra-low ash semi-soft coking coal can be produced from Jan Karski at coking qualities that have the potential to achieve market pricing of some 10% above the standard international semi-soft coking coal benchmarks.
With the expected closure of coal mines in the Czech Republic that produce this product by 2022 there is a growing regional market opportunity.
Preliminary discussions with select European steelmakers have confirmed the suitability of ultra-low ash, high Coke Strength after Reaction (CSR) semi-soft coking coal for utilisation in coke oven blends.
Towards the end of the month PDZ confirmed that its Deposit Development Plan for Jan the Karski exploration project had been approved by the Lublin Regional Mining Authority, paving the way for a mining concession application.
The Prefeasibility Study (PFS) for the Jan Karski project points to steady-state annual production of 6.3 million tonnes per annum at average operating costs of US$25 per tonne over an initial mine life of 24 years, implying substantial margins for its product with the three-year mid-point semi-soft coking coal price in the order of US$100 per tonne.
This is broadly in line with forward industry forecasts with perhaps the potential for the Jan Karski mine’s quality coal to fetch a premium of circa 10%, implying a price in the vicinity of US$110 per tonne.
Based on PFS metrics, Jan Karski is expected to generate annual steady-state earnings before interest, tax, depreciation and amortisation (EBITDA) of US$348.1 million.
It is also worth noting that the Scoping Study for PDZ’s Debiensko premium hard coking coal project that was completed in the first quarter of 2017 points to annualised EBITDA of US$282 million over a 26 year mine life.
PDZ definitely appears to be punching above its weight with the value of the company’s assets arguably not captured in its market capitalisation of $86 million.
While PDZ’s shares recently hit a three-year high of 60 cents, the company is far more progressed with its projects than it was in 2014, and the fact that it has extrapolated firm numbers regarding the economic viability of both Jan Karski and Debiensko mines could form the basis of a longer term share price rerating.
Indeed, this is reflected in broker price targets. The consensus price target across the brokers covering PDZ is currently $1.46.
Of course, broker projections and price targets are only estimates and may not be met.
Peninsula Mines (+14.3%)
In the last three months shares in Peninsula Mines (ASX: PSM) have increased from 2.1 cents to 2.4 cents, implying a gain of 14.3%.
As with the other small caps in this article share trading patterns should not be used as the basis for an investment and may not be replicated.
The surge that has occurred in the last fortnight has come on the back of promising analytical results from 110 systematic surface rock chip samples collected from 70 identified historical mine workings at Chilbo, part of the group’s Ubeong zinc-silver project in South Korea.
These included grades of up to 48.8% zinc and 958 grams per tonne (ppm) silver. High grade gold mineralisation was also identified with a prominent sample recording 4.87 grams per tonne.
While it is early days for PSM, the high grade results from rock chip sampling will assist the company in defining drilling targets for high-grade sulphide mineralisation to be tested in 2017.
Capital Mining (+11%)
Shares in Capital Mining (ASX: CMY) more than doubled in April after the company announced that it had been granted exploration licences for a number of its Western Australian lithium projects.
It should be noted that share trading patterns should not be used as the basis for an investment as they may or may not be replicated. Those considering this stock should seek independent financial advice.
However, a lull between this news being released and CMY launching its exploration program has resulted in the company’s share price retracing.
While the group’s shares increased 11% in the three months to May 31, they have trended downwards in the last month under low volumes.
This could well change in June with the company announcing in mid-May that plans have been formalised for a detailed second phase field program to follow-up on its initial reconnaissance.
The follow-up program is designed to further refine priority target areas and confirm drill targets within the granted tenement portfolio.
Exploration in the current program will include detailed, targeted soil sampling over the Big Bell, Mindoolie and Dalgaranga tenements in order to generate targets for a maiden drilling program.
General Information Only
S3 Consortium Pty Ltd (S3, ‘we’, ‘us’, ‘our’) (CAR No. 433913) is a corporate authorised representative of LeMessurier Securities Pty Ltd (AFSL No. 296877). The information contained in this article is general information and is for informational purposes only. Any advice is general advice only. Any advice contained in this article does not constitute personal advice and S3 has not taken into consideration your personal objectives, financial situation or needs. Please seek your own independent professional advice before making any financial investment decision. Those persons acting upon information contained in this article do so entirely at their own risk.
Conflicts of Interest Notice
S3 and its associated entities may hold investments in companies featured in its articles, including through being paid in the securities of the companies we provide commentary on. We disclose the securities held in relation to a particular company that we provide commentary on. Refer to our Disclosure Policy for information on our self-imposed trading blackouts, hold conditions and de-risking (sell conditions) which seek to mitigate against any potential conflicts of interest.
Publication Notice and Disclaimer
The information contained in this article is current as at the publication date. At the time of publishing, the information contained in this article is based on sources which are available in the public domain that we consider to be reliable, and our own analysis of those sources. The views of the author may not reflect the views of the AFSL holder. Any decision by you to purchase securities in the companies featured in this article should be done so after you have sought your own independent professional advice regarding this information and made your own inquiries as to the validity of any information in this article.
Any forward-looking statements contained in this article are not guarantees or predictions of future performance, and involve known and unknown risks, uncertainties and other factors, many of which are beyond our control, and which may cause actual results or performance of companies featured to differ materially from those expressed in the statements contained in this article. S3 cannot and does not give any assurance that the results or performance expressed or implied by any forward-looking statements contained in this article will actually occur and readers are cautioned not to put undue reliance on forward-looking statements.
This article may include references to our past investing performance. Past performance is not a reliable indicator of our future investing performance.