
If America sneezes should we catch a cold
Published 30-AUG-2019 11:04 A.M.
|
9 minute read
Hey! Looks like you have stumbled on the section of our website where we have archived articles from our old business model.
In 2019 the original founding team returned to run Next Investors, we changed our business model to only write about stocks we carefully research and are invested in for the long term.
The below articles were written under our previous business model. We have kept these articles online here for your reference.
Our new mission is to build a high performing ASX micro cap investment portfolio and share our research, analysis and investment strategy with our readers.
Click Here to View Latest Articles
Investors are always quick to cry foul when our sharemarket is ambushed by global dynamics, but not too concerned when we ride on the coattails of positive international sentiment.
Concerns expressed by Australian investors seem fair enough given that they have watched billions of dollars wiped off the ASX because of twitter traffic such as Trump’s tweets on US/China trade wars or the Rocket Man’s penchant for missiles?
That’s a million miles away, so surely in the land down under we are insulated from the madness in the Northern Hemisphere, and that includes Brexit.
But, as the saying goes when America sneezes the rest of the world catches a cold.
Which raises the question, will Australia catch a cold, or worse still, are the recent aches and pains a forerunner to a bad dose of the flu?
While Finfeed can’t pull out the crystal ball and give you a definitive answer on where our markets are going in the near or medium-term, we have collated a wealth of data, both current and historical which will hopefully help you to make an informed assessment.
Sometimes it’s not just a matter of bailing out of the sharemarket altogether, but tweaking your portfolio to suit certain circumstances, and we will touch on that a little later.
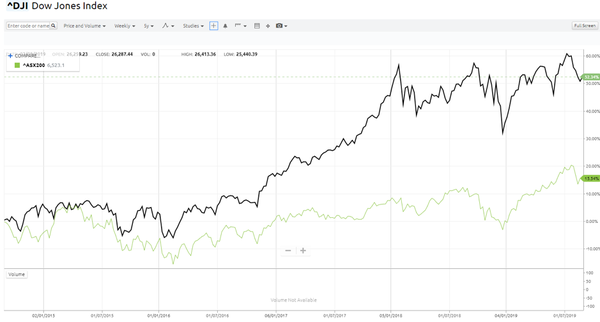
From a broader perspective, a good place to start is to look at a five-year window which compares the Dow Jones Index and the S&P/ASX 200.
As you will see below, the former has run extremely hard, particularly in the last three years since Trump was elected President of the US.
Ironically, much of the volatility can be attributed to Trump’s inability to negotiate professionally, diplomatically, and in a measured fashion that creates confidence rather than uncertainty.
Geopolitical tensions can cause enough volatility as it is, but when unexpected, erratic and impulsive tweets take the place of planned press releases and formal policy statements the situation is significantly exacerbated.
On that note, we are on the countdown to a 2 November, 2020 presidential election, so get ready for a rough ride.
That said, as the chart above shows, the Dow (black line) is up more than 50% in the last five years, while the ASX 200 is only up approximately 15%.
Consequently, if the bubble is to burst our fallout shouldn’t be as bad.
That assumption could be brought into question though, given the quantum of the falls in the two indices in August.
The chart indicates that the Dow pulled back from being up just over 60% relative to the five-year period, to being up about 50%, effectively losing about 16% of its gain.
By comparison, the ASX 200 lost about 25% of its gain, retracing from being up about 20% to 15% in a fortnight.
However, history shows that some degree of equilibrium can be restored if our economy is robust.
On that note, it is interesting to examine the following chart, as it could be an early sign that Australia is positioned to deal with the global headwinds better than many other countries, and indeed the US.
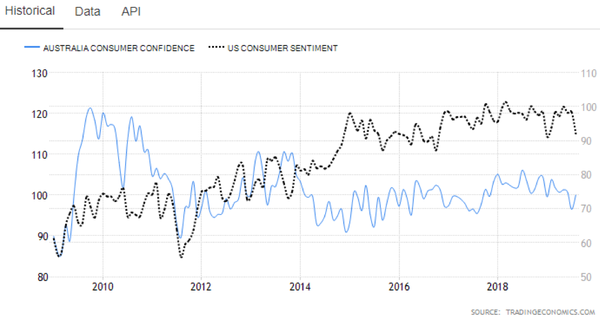
If you cast an eye back to the period 2009 to 2014 you will see that Australian consumer confidence closely tracked the US, except we recovered much more strongly from the GFC than the US did between 2009 and 2011.
Post 2014, a significant disconnect emerged between consumer confidence in Australia and the US.
You will see around 2015 when Australian consumer confidence was hovering in the vicinity of 70, the US was some 30 basis points higher using the Australian points scale as the common denominator (right-hand side y-axis).
This was the beginning of the Trump effect as the masses believed in his ability to ‘make America great again.’

However, the slogan has worn thin, only 13% of the wall has been built, his diplomatic skills haven’t improved and the rustbelt states that delivered Trump the White House in 2016 are restless.
So does the chart above indicate that consumers have recognised a pending period of uncertainty?
Rarely has there been such a sharp inverse correlation in consumer confidence than that which emerged in July/August.
Based on the RHS y-axis of the above chart which denotes Australian consumer confidence, there was a 3.6% increase to approximately 100 points.
Based on the same axis, US consumer confidence plunged nearly 10%.
Apart from indicating that our index is heading in a promising direction, it is also worth noting that we are at a point that has traditionally been a sweet spot in terms of stability - not too high, not too low.
The state of the nation
Trading Economics recently weighed up the consumer sentiment figures for Australia, but the group also looked into the Australian economy in more depth, pointing to some other indicators which are worth considering in terms of assessing both the economic health of our country and the financial status of those who carry debts, earn wages, save money, buy goods and hopefully have some funds left over for investment.
The following is an excerpt which includes a two year snapshot of business confidence (bar chart).
The Melbourne Institute and Westpac Bank Consumer Sentiment Index for Australia increased 3.6% to 100 in August 2019 from July's two-year low, as people became more upbeat following the Federal election results and the recent RBA interest rate cuts, while further signs of improvement in the property market also supported.
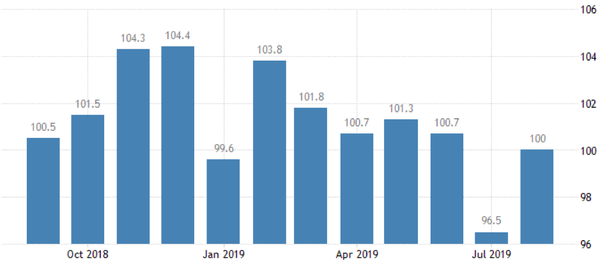
The survey's measure of economic conditions for the next 12 months soared 9.6% and the measure of confidence regarding the economic outlook for the next five years rose 4.5%, with fears of job loss easing nearly 1%.
Also, the gauge of family finances compared to a year ago advanced 0.9%, the highest in five months, and the gauge measuring expected personal finances rose 0.7%.
Meantime, the index of whether it was a good time to buy a major household item went up 2.8%.
Consumer Confidence in Australia averaged 101.35 Index Points from 1974 until 2019, reaching an all-time high of 123.94 Index Points in May of 2007 and a record low of 64.61 Index Points in November of 1990.
Reflecting on the above data, the record high of nearly 124 points was quickly followed by a substantial plunge as the global financial crisis unfolded.
Looking back over the decades, lofty highs have been a bubble on the verge of bursting, resulting in confidence falling to extremely low levels.
Depressed consumer confidence tends to have a broad-based effect with only a few sectors of the economy escaping the impact of negative sentiment.
Companies that come under the non-discretionary banner such as grocery stores, liquor outlets and medical facilities tend to be less affected.
However, despite the volatile geopolitical environment and the associated plunge in equity markets, Australia’s consumer confidence numbers look healthy.
Firstly, they aren’t at extreme highs that suggest a downturn is imminent, nor are they at low levels that would normally negatively impact upon consumer spending.
However, as we mentioned there are other factors worth considering, and some of these don’t paint a pretty picture.
Where has all the money gone?
Like Joe Citizen at the end of each pay period, you can cast your eye across some of the financial data that relates to Australian wage earners, homeowners and consumers and scratch your head, wondering where all the money has gone.
The following chart indicates that for the best part unemployment (blue line) hasn’t been an issue.
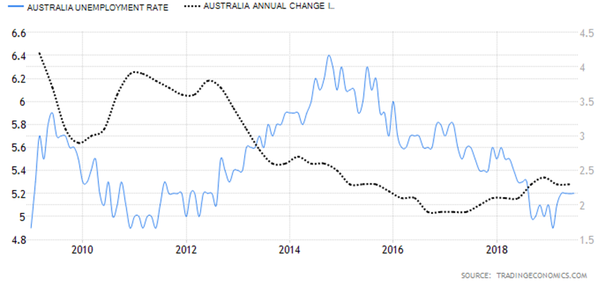
While wage growth (black line) has been stagnant, so has inflation.
Supermarket price wars have now spilled over into the petrol station industry, keeping a lid on the prices of essential items.
The entry of a number of new players has put pressure on the long-standing Coles/Woolworths duopoly, and when you take into account the fact that another new entrant has just arrived on scene in Kaufland, joining the likes of Aldi and Costco which are primed for expansion, competition may continue to suppress inflation.
However, getting back to the broader issues of unemployment and wage growth you can see that the impressive fall in unemployment has been accompanied by a sharp fall in wage growth, which to some extent would account for the fairly alarming figures regarding our inability to put some money aside for a rainy day, or perhaps on a more sombre note for when mortgage rates begin to increase.
However, let’s look first at the status of our savings (black line) relative to household debt across a 10 year time span.
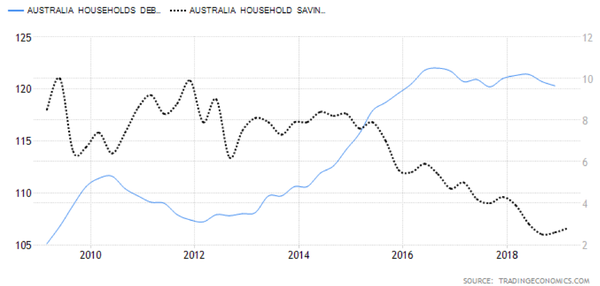
Add the following chart into the mix and you can see what a profound impact it would have if home loan interest rates were to even rise marginally.
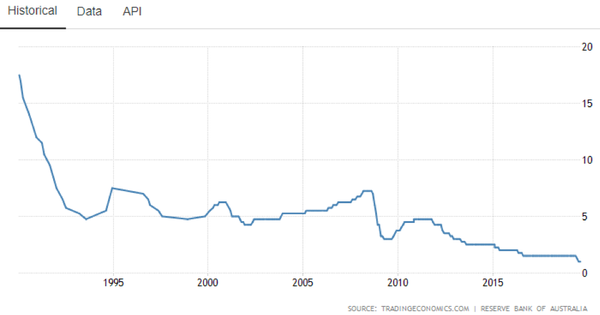
Cast your eye back some 30 years and you can see how ugly the mortgage rate situation can be compared with the record lows of today.
But this also raises the question as to why household debt has increased to such high levels, while personal savings have slumped to extreme lows.
Granted, you could say that declining mortgage rates and pre-Royal Commission flexible lending arrangements made it easier to borrow.
But with wage growth broadly static over the last four years, as well as low unemployment and inflation coinciding with a decline of more than 50% in the mortgage rate (cash rate) as set by the RBA and broadly followed by the banks, one would expect household savings to look a lot better.
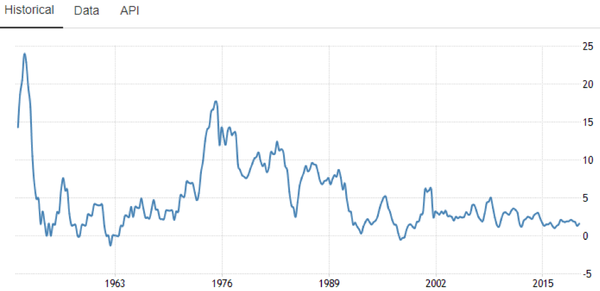
As you can see below, the inflation rate in recent years has been close to the lowest levels across a period of 70 years.
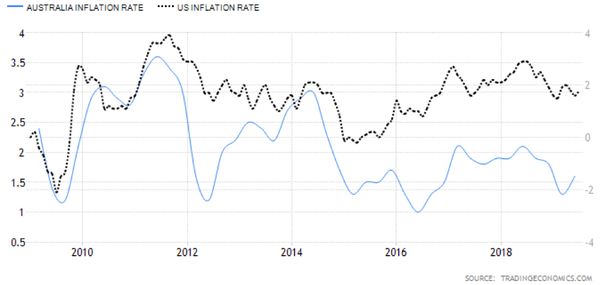
However, it is the following chart that perhaps provides some comfort if we are weighing up how Australia is going to fair against the US, as it shows the significantly lower inflation in our economy over the last 10 years.
Where to invest
We said earlier that we would examine sectors that may be best placed to take advantage of the prevailing economic environment.
One of the main themes to come out of our investigation into the strength of the Australian economy and the finances of those who are instrumental in creating momentum through earning wages, buying goods, saving money etc, is that we could suffer extreme mortgage stress in the event of increased unemployment, sustained low wage growth or interest rate increases.
This can impact financial institutions, the construction sector and the discretionary retail industry, to name a few.
The flow on impact of a depressed construction sector is extensive as it affects all areas of employment linked to the manufacture and distribution of cement to bathroom fittings and kitchen appliances.
There is a recent trend towards safe haven sectors with the Healthcare Sector (S&P/ASX 200:XHJ) significantly outperforming the likes of Consumer Discretionary (S&P/ASX 200:XDJ) and even Consumer Staples (S&P/ASX 200:XSJ), with the latter arguably reflecting the challenging conditions experienced in the grocery sector due to an increasingly competitive environment.
For the best part, health expenditure is essential, and given the ageing population spending is expected to accelerate in the coming years.
General Information Only
S3 Consortium Pty Ltd (S3, ‘we’, ‘us’, ‘our’) (CAR No. 433913) is a corporate authorised representative of LeMessurier Securities Pty Ltd (AFSL No. 296877). The information contained in this article is general information and is for informational purposes only. Any advice is general advice only. Any advice contained in this article does not constitute personal advice and S3 has not taken into consideration your personal objectives, financial situation or needs. Please seek your own independent professional advice before making any financial investment decision. Those persons acting upon information contained in this article do so entirely at their own risk.
Conflicts of Interest Notice
S3 and its associated entities may hold investments in companies featured in its articles, including through being paid in the securities of the companies we provide commentary on. We disclose the securities held in relation to a particular company that we provide commentary on. Refer to our Disclosure Policy for information on our self-imposed trading blackouts, hold conditions and de-risking (sell conditions) which seek to mitigate against any potential conflicts of interest.
Publication Notice and Disclaimer
The information contained in this article is current as at the publication date. At the time of publishing, the information contained in this article is based on sources which are available in the public domain that we consider to be reliable, and our own analysis of those sources. The views of the author may not reflect the views of the AFSL holder. Any decision by you to purchase securities in the companies featured in this article should be done so after you have sought your own independent professional advice regarding this information and made your own inquiries as to the validity of any information in this article.
Any forward-looking statements contained in this article are not guarantees or predictions of future performance, and involve known and unknown risks, uncertainties and other factors, many of which are beyond our control, and which may cause actual results or performance of companies featured to differ materially from those expressed in the statements contained in this article. S3 cannot and does not give any assurance that the results or performance expressed or implied by any forward-looking statements contained in this article will actually occur and readers are cautioned not to put undue reliance on forward-looking statements.
This article may include references to our past investing performance. Past performance is not a reliable indicator of our future investing performance.