
Gold glitters in perfect storm
Hey! Looks like you have stumbled on the section of our website where we have archived articles from our old business model.
In 2019 the original founding team returned to run Next Investors, we changed our business model to only write about stocks we carefully research and are invested in for the long term.
The below articles were written under our previous business model. We have kept these articles online here for your reference.
Our new mission is to build a high performing ASX micro cap investment portfolio and share our research, analysis and investment strategy with our readers.
Click Here to View Latest Articles
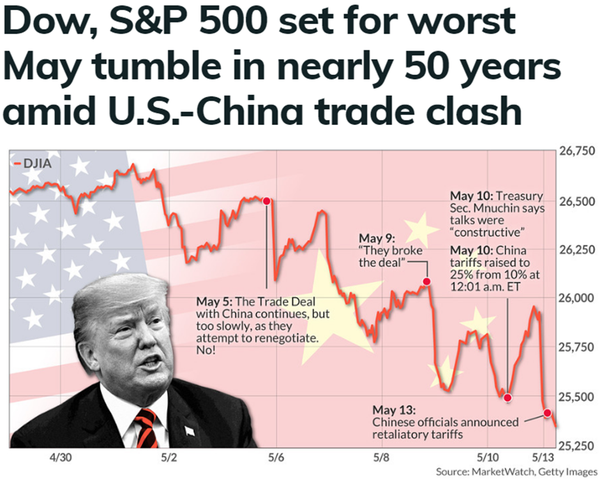
Wall Street opened to a horror day on Monday (US time), and as the bell rang the Dow Jones index (INDEXDJX:DJI) was down nearly 2.4% or 617 points.
This represented a close of 25,325 points, but it was much worse at one stage as the index hovered in the vicinity of 25,220 points.
If MarketWatch’s following headline is on the mark with its predictions of further devastation on Wall Street, history shows that gold will be the winner.
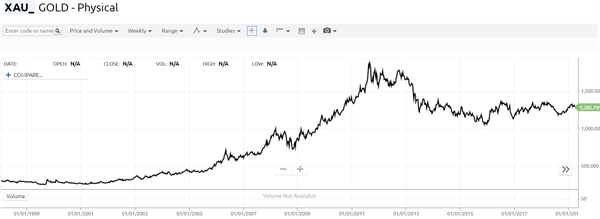
As indicated below, the precious metal has already shown its resilience over a ten year period, consistently trading above the US$1000 per ounce mark, and for the most part over the last three years showing strength around the mid-point of a range between US$1200 per ounce and US$1350 per ounce.
Having examined recent gold price projections framed by Macquarie, it would seem that the broker is confident regarding the outlook for the precious metal.
Macquarie is forecasting an average price of US$1319 per ounce in 2019, increasing significantly in 2020 to US$1431 per ounce.
Between 2021 and 2024 the broker estimates that the average price will be in a range between US$1363 per ounce and US$1479 per ounce.
History suggests there is further upside
After surging from approximately US$1270 per ounce at the start of May to eclipse the psychological US$1300 per ounce mark on Monday night as US equity markets went into freefall, there appears to be a compelling case for further upside.
There is an inverse historical relationship between the gold price and global equities.
One of the most notable examples was during the global financial crisis when the precious metal spiked more than 30% in three months between December 2008 and February 2009.
This represented an increase of approximately US$250 per ounce, highlighting the possibility of a short and sharp rerating if Wall Street implodes.
Similarly, uncertain sentiment towards equities markets in 2011 which saw the Dow shed 1000 points resulted in the gold price surging more than US$500 per ounce as it hit an all-time high of approximately US$1900 per ounce.
Buying from China provides added support
Not only is China instrumental in driving up the price of gold through its trade war with the US, it has been stocking up the coffers with the precious metal for some time now.
This shows no signs of abating given that the underlying rationale is to establish some protection ahead of an expected slowing in the economy in coming years.
Russia has also adopted a ‘go for gold’ strategy, reportedly swapping its oil and gas for the precious metal.
However, it is China that has really come under the spotlight with Bloomberg reporting:
“China’s on a bullion-buying spree as Asia’s top economy expanded its gold reserves for a fourth straight month, adding to investors’ optimism that central banks from around the world will press on with a drive to build up holdings.
“The People’s Bank of China raised reserves to 60.62 million ounces in March from 60.26 million a month earlier, according to data on its website on Sunday.
“In tonnage terms, last month’s inflow was 11.2 tons, following the addition of 9.95 tons in February, 11.8 tons in January and 9.95 tons in December.
“The latest data from the PBOC indicate that the country has resumed adding gold to its reserves at a steady pace, much like the period from mid-2015 to October 2016, when the country boosted holdings almost every month.”
During that window of time, the gold price increased from about US$1100 per ounce to US$1350 per ounce.
Implications for Australian stocks
The resurgence in the gold price is obviously good news for Australian gold companies, and this was reflected in today’s 3% increase in the S&P/ASX All Ordinaries Gold Index (ASX:XGD).
However, it is the quantum of the increase, particularly against a circa 70 point fall in the S&P/ASX 200 Index (ASX:XJO) that underlines the added benefits on offer for those companies producing gold in Australia.
The following chart which has the XGD in black, the gold price in green and the AUD:USD exchange rate in blue tells the story.
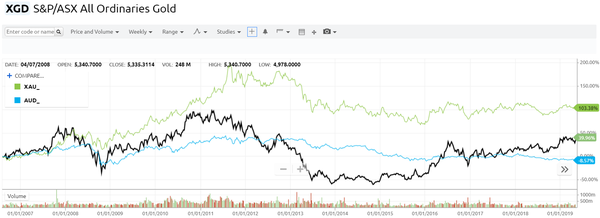
You can see that the gold price has traded in a tight range since the start of 2017, but the XGD has increased from about 3500 points to touch on 6000 points today, the first time it has revisited that level in nearly 7 years.
A key contributor to this outperformance has been a weakening in the Australian dollar against the US dollar which after trading above US$0.81 at the start of 2018, has now fallen below US$0.70.
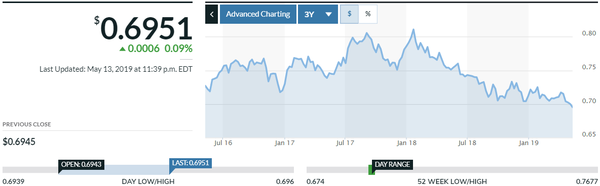
A low Australian dollar equates to a much better gold price for Australian producers.
With the continued widening of the gap between a strong gold price and a weak Australian dollar illustrated above, rarely has there been a better time for Australian gold miners with the precious metal currently fetching approximately $1870 based on the current rate of US$0.695.
The other trend to focus on is the growing gap between the Australian dollar and the XGD, particularly since mid-2018 - the breadth of this spread is a reasonable barometer in terms of providing a snapshot of the climate for Aussie gold stocks.
As one would expect, both emerging and established gold mining companies operating in Australia experienced strong share price momentum.
While index heavyweights Newcrest Mining (ASX:NCM), Regis Resources (ASX:RRL) and Northern Star (ASX:NST) enjoyed good gains of 1.4%, 5.7% and 3.5% respectively, there were also strong performances from small and mid-tier players.
In some cases these delivered superior returns, a trend which is not unusual when the focus has been off a sector and value emerges in smaller stocks.
For example, shares in Western Australian miners Silver Lake Resources (ASX:SLR) and Saracen Mineral Holdings (ASX:SAR) were up more than 6% in morning trading.
When it comes to gold, often the deeper you dig the better the grades.
Similarly, when it comes to finding value in a market that is charging ahead, a key to success is unearthing those stocks that tend to fly under the radar.
General Information Only
S3 Consortium Pty Ltd (S3, ‘we’, ‘us’, ‘our’) (CAR No. 433913) is a corporate authorised representative of LeMessurier Securities Pty Ltd (AFSL No. 296877). The information contained in this article is general information and is for informational purposes only. Any advice is general advice only. Any advice contained in this article does not constitute personal advice and S3 has not taken into consideration your personal objectives, financial situation or needs. Please seek your own independent professional advice before making any financial investment decision. Those persons acting upon information contained in this article do so entirely at their own risk.
Conflicts of Interest Notice
S3 and its associated entities may hold investments in companies featured in its articles, including through being paid in the securities of the companies we provide commentary on. We disclose the securities held in relation to a particular company that we provide commentary on. Refer to our Disclosure Policy for information on our self-imposed trading blackouts, hold conditions and de-risking (sell conditions) which seek to mitigate against any potential conflicts of interest.
Publication Notice and Disclaimer
The information contained in this article is current as at the publication date. At the time of publishing, the information contained in this article is based on sources which are available in the public domain that we consider to be reliable, and our own analysis of those sources. The views of the author may not reflect the views of the AFSL holder. Any decision by you to purchase securities in the companies featured in this article should be done so after you have sought your own independent professional advice regarding this information and made your own inquiries as to the validity of any information in this article.
Any forward-looking statements contained in this article are not guarantees or predictions of future performance, and involve known and unknown risks, uncertainties and other factors, many of which are beyond our control, and which may cause actual results or performance of companies featured to differ materially from those expressed in the statements contained in this article. S3 cannot and does not give any assurance that the results or performance expressed or implied by any forward-looking statements contained in this article will actually occur and readers are cautioned not to put undue reliance on forward-looking statements.
This article may include references to our past investing performance. Past performance is not a reliable indicator of our future investing performance.