
Where to get your slice of base metal exposure in 2017
Published 30-NOV-2016 15:16 P.M.
|
25 minute read
Hey! Looks like you have stumbled on the section of our website where we have archived articles from our old business model.
In 2019 the original founding team returned to run Next Investors, we changed our business model to only write about stocks we carefully research and are invested in for the long term.
The below articles were written under our previous business model. We have kept these articles online here for your reference.
Our new mission is to build a high performing ASX micro cap investment portfolio and share our research, analysis and investment strategy with our readers.
Click Here to View Latest Articles
There has been extreme volatility across precious and base metals in the last few months, as well as a strengthening in hard rock materials such as coal and iron ore.
There is a sense of uncertainty about gold with many market commentators suggesting it would hit extreme highs or extreme lows depending on the Trump transition. His election win was responsible for the precious metal increasing from US$1275 on the day prior to the election to a high of US$1337 when news of his victory became apparent.
However, the safe haven buying quickly evaporated and in the space of a week gold fell to circa US$1220, a level that proved to be a resistance point in May/June 2016 when it retraced from similar levels.
However, the US$1200 mark appeared to be a crucial inflection point with a sustained fall below that level in July 2015 being the start of a sharp decline which saw it bottom out around US$1050.
A similar story seems to be playing out with the precious metal plunging from circa US$1210 per ounce to US$1180 per ounce last Wednesday.
Out of precious, into base – and don’t forget lead
Sustained weakness in the ensuing week suggests it may be time to consider options in the base metals sector, particularly those that have applications in the production of stainless steel, a product that is used extensively in the manufacture of everything from kettles to cars.
While there have recently been some strong performances across copper, nickel and zinc, with the latter being the star base metal commodity in 2016 there is evidence to suggest further upside exists for all three metals.
Of course this may not translate to stocks operating in these sectors, so investors looking at this market should seek professional financial advice before entering or considering any specific companies for their portfolio.
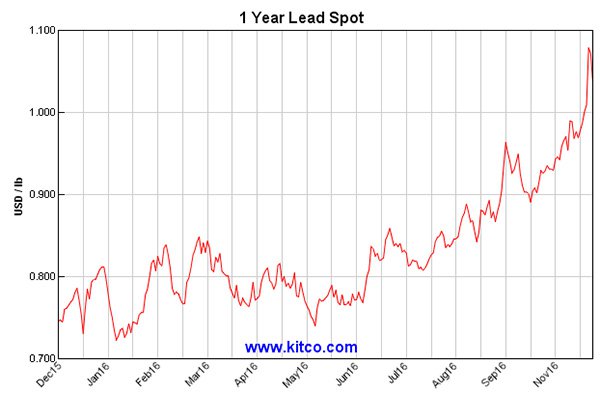
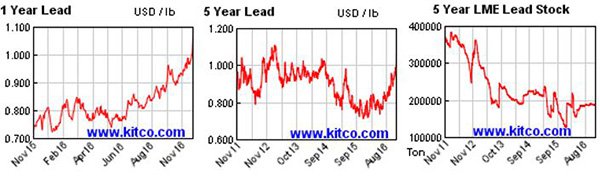
It is also worth considering lead producers as this commodity has historically tracked the zinc price, but tends to have flown under the radar until a sharp spike occurred at the end of last week.
Value to be found in base metals
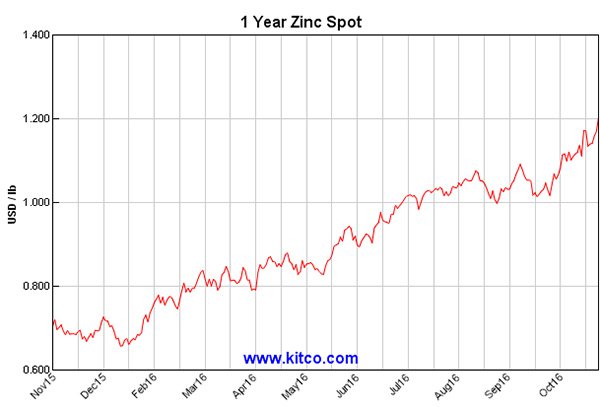
Zinc has run hard in 2016, increasing from circa US$0.65 per pound to a recent high of US$1.27 per pound. While analysts are generally of the view that a lack of new supply combined with sustained demand should provide support around current levels, most are pondering what will be the zinc of 2017.
However, as analysts at Macquarie Wealth Management highlighted this week, the zinc/lead story is far from over. The broker noted that LME lead and zinc prices surged higher on Friday with the former gaining 6.9% to close just shy of US$2400 per tonne which is the highest since February 2013.
Referring in fairly colourful terms to last week’s activity the broker said, “Three month lead prices ripped through that barrier after the curb with a peak of US$2412.50 per tonne printed, while zinc roared throughout the day ending up 4% to first breach and then leave in the dust the US$2800 per tonne level with a late intraday peak of US$2883 per tonne, a nine year high”.
Substantial spikes in copper and nickel over the last month have created new interest in these commodities. Examining the sharp increases that have occurred on a short-term comparative basis perhaps suggests this is just too good to be true, but could it be the start of a sustained rally in 2017.
Looking at the big picture for nickel and copper
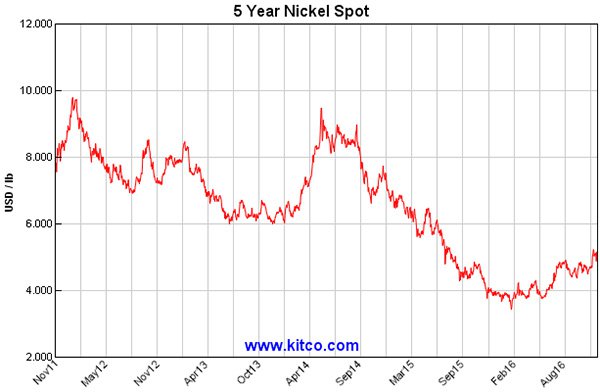
Just to throw some light on the extent of the recent increases, nickel spiked from circa US$4.50 per pound in late October to hit a high of US$5.22 per pound in early November, representing an increase of 16%.
While it has since retraced to circa US$5.00 per pound, short-term charts make it easy to walk away with a ‘too good to be true’ opinion as far as the potential for a sustained rally is concerned.
It is worth bearing in mind that 18 months ago nickel was hovering in the vicinity of US$6.50 per pound and in mid-2014 it spiked from US$6.00 per pound to more than US$9.00 per pound in a matter of months.
This wasn’t driven by a euphoric pre-GFC type boom, it was merely the forces of supply and demand at work. To get an idea of what the unsustainable boom price was, multiply the current price by about five.
To consider it from another perspective, if the current price from was doubled it would be shy of the breakout high that was struck in 2006 before the mining boom got into full swing. It would also be short of the post GFC rally peaks in 2010 and 2011 which saw prices in the vicinity of US$10.00 per pound.
The following chart shows what a nickel boom spike really looks like (US$/tonne), with +US$50000 per tonne making recent gains seem meagre (20 year chart sourced from Stock Doctor).
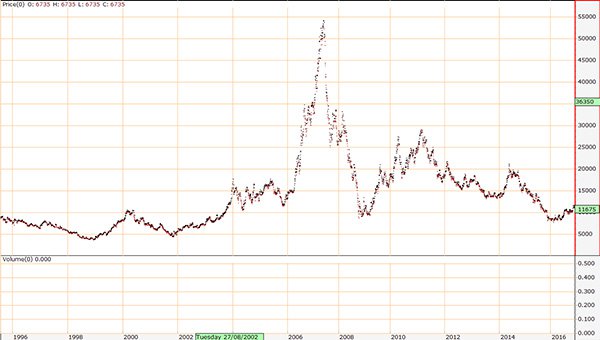
An 80% increase from current levels would place it broadly in line with the May 2014 peak that was reached prior to the most recent downturn that saw nickel slump to sub-US$4.00 per pound, which was not only below the GFC low, but represented a retracement to pre-mining boom levels when the industrial might of China was much less a driving force behind demand.
Think zinc
Another way of looking at the sustainability of the rallies in nickel and copper is to compare them with the trend line of zinc in 2016.
In less than a month between mid-January and mid-February the metal increased 19% to circa US$0.78 per pound. Few were prepared to suggest a further 60% accretion would occur before the year was out.
At a later stage we examine how conservatively the analysts initially responded to the zinc spike in early 2016, and if we overlay that with the moderate commodity price upgrades that have recently occurred in relation to copper it may well be folly to suggest that the experts have got it right this early in the rally.
If we translate this to nickel it would equate to circa US$8.00 per pound, approximately the midpoint of the recent post GFC low and the post GFC high struck in 2011.
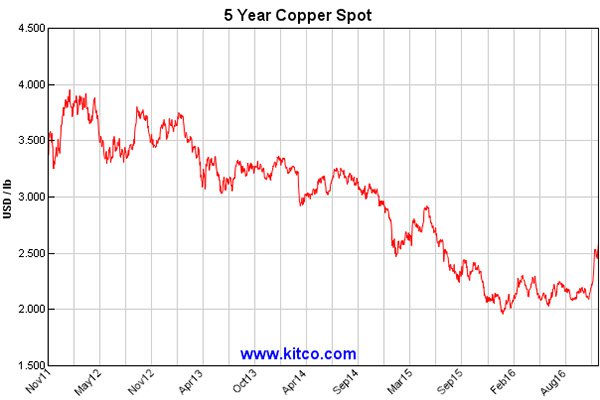
What does Doctor Copper say
There is a good reason why the base metal, copper is referred to as Doctor Copper. Because of its many applications across the manufacturing industry, its use in the development of infrastructure, as well as commercial and residential construction it tends to reflect the level of economic activity on a global basis.
Copper is often seen as a lead indicator of other metals given its applications in the manufacture of stainless steel which also require nickel and zinc. Likewise, if these are in demand, there is a good chance that both coal and iron ore will be in demand as coal provides the heat required to transform a mix of iron ore and other base metals into refined products.
Consequently, if we run the same metrics across copper as we did nickel we should theoretically arrive at a price target close to the midpoint of the post GFC high/low range, which is in the vicinity of US$3.40 per pound.
This is arguably a big call given that it is roughly US$0.80 per pound higher than the current price, but one that could come to fruition. After all, the experts weren’t tipping a 30 day/25% rally in October/November.
Given our projections would require a significant rerating it is well worth examining how the experts have responded to recent developments.
It is also worth noting that commodity prices do fluctuate and caution should be applied to any investment decision in the commodities sectors and not be based on spot prices alone. Seek professional financial advice before choosing to invest.
What are the analysts saying
On November 14, Macquarie Wealth Management noted that spot copper prices had surged out of the tight trading range, rising more than 15% in a week and more than 20% since the late October low.
The broker highlighted that copper fundamentals had improved and suggested that increased investment in infrastructure in the US as flagged by President-Elect, Donald Trump could provide support. This was the rationale behind Macquarie’s decision to upgrade copper price forecast by between 11% and 15% over the next four years.
The revised figures reflect a calendar year 2017 copper price of US$2.43 per pound, well below the back of the envelope machinations I mentioned. However, before you write off copper it is worth stepping back to the start of 2016 when Macquarie accurately called the rebound in zinc, but was well short of current prices with its projections.
If Macquarie is as far off the mark as it was with zinc our projections are close to the money
In a note dated January 8, 2016, Macquarie Wealth Management said it expected zinc to lift by 23% to average US$1833 per tonne in fiscal 2016. However, the broker noted at the time that its numbers may even be too cautious, noting that its implied average price still left the metal below the previous year’s three month average of US$1942 per tonne.
Of course, what played out was a huge rally which has seen the metal eclipse US$2800 per tonne in the last week, circa 55% or US$1000 per tonne ahead of Macquarie’s expectations.
If copper was to exceed Macquarie’s forecasts to the extent that zinc outperformed its expectations, this would imply a price of approximately US$3.70 per pound, well ahead of our US$3.40 per pound back of the envelope metrics.
Nickel and copper LME warehouse stocks both on the decline
If we make the assumption that our bullish scenario is achievable in terms of what has happened in the past, it is then time to assess the present in order to determine whether these trends will play out.
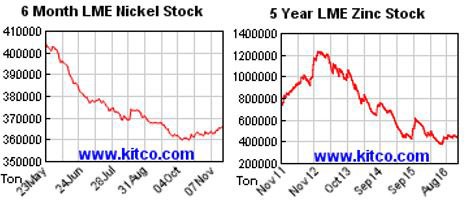
This largely comes down to supply and demand, and as you will see in the charts below there has been a downturn in LME warehouse stocks in all three commodities over the last 12 months, albeit at different stages.
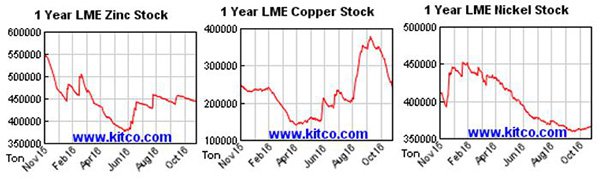
The following sharp decline that can be seen in the six month LME nickel warehouse stock chart is perhaps an insight into the perceived decline in warehouse stocks that contributed towards the recent spike in the price of nickel. On the other hand, a five-year chart of zinc LME stocks as seen below is useful in identifying why its rally started some 12 months ago.
Stocks to target
We have chosen a six-pack of stocks from each commodity with some in production, and a few near-term emerging producers, while also including some more speculative plays. We haven’t included big names such as Rio Tinto, BHP Billiton and South32, as there is plenty of information out there on those stocks.
Many of the companies are exposed to multiple commodities, and with this in mind we have grouped them according to the commodity that is likely to be the major revenue earner.
On the score of overlapping commodities, one base metal that receives little airplay but has performed extremely well over the last 12 months is lead. It has historically tracked the zinc price fairly closely, and this trend is evident in the following charts.
Consequently, when we reference it as part of a multi-commodity portfolio don’t discard its relevance, particularly when you consider the relatively low warehouse stocks as indicated below and the recent price spike.
Unless otherwise indicated, charts were sourced from www.kitcometals.com.
Copper
Oz Minerals
Like many copper producers Oz Minerals (ASX: OZL) extracts a significant amount of gold from the ore that is processed. However, in OZL’s case gold makes a substantial contribution and the revenue contribution from the precious metal should only increase over the next three years unless there is a change in the group’s asset portfolio.
Copper production from OZL’s Prominent Hill mine is expected to come off substantially between 2017 and 2019. Management’s mid-range guidance at this stage indicates copper production will fall from 110,000 tonnes in 2017 to 90,000 tonnes in 2018, and then 70,000 tonnes in 2019.
Helping to compensate from the flow on decline in revenues will be an uptick in gold production from Prominent Hill which is expected to increase from approximately 130,000 in 2017 ounces to 160,000 ounces in 2019.
Strategically though, the following graphic sums up where management wants to take the business in the medium to long-term.
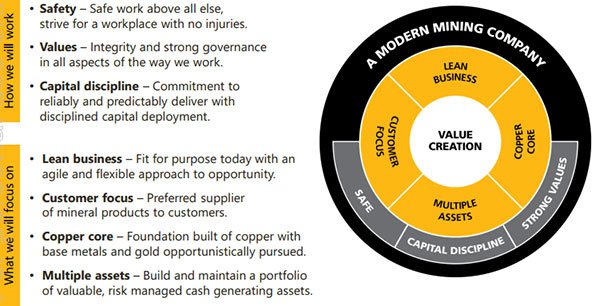
Carrapateena to the rescue – but value questionable
Analysts at Macquarie Wealth Management crunched the numbers on OZL a fortnight ago and they estimate that revenues will slide from $897 million in 2017 to $816 million in 2019.
The impact of this fall in revenue, combined with the costs of bringing its new Carrapateena project on stream will result in EBITDA falling from $512 million in 2017 to $312 million in 2019 based on Macquarie’s projections. The broker is forecasting OZL will record a net loss of $10 million in 2019.
This appears to be a far from compelling near to medium-term outlook. While Macquarie has warmed to the Carrapateena project since there has been some improvement in the copper price, it was particularly critical of the project in July saying, “We remain bearish on the decision to develop Carrapateena on a standalone basis given that on our copper price forecasts the project does not generate a return that materially exceeds the company’s cost of capital, commits and gears the balance sheet with only a margin NPV and takes circa 15 years to pay back the capital investment”.
While more recent commentary provided at the start of November was a little more complimentary, the broker highlighted that capital costs of nearly $1 billion referred to in the prefeasibility study were broadly unchanged and that the project remained highly leveraged to long-term copper prices which would need to be above US$3.00 per pound to deliver what it considers to be a robust economic return.
Macquarie’s price target is $9.20, implying a PE multiple of 20.4 relative to the broker’s forecasts for the 12 months to December 31, 2016. While Macquarie is forecasting earnings per share growth of circa 35% in 2017, it is projecting a breakeven year in 2018 followed by a loss in 2019.
Broker projections and price targets are only estimates and may not be met. Also, historical data in terms of earnings performance and/or share trading patterns should not be used as the basis for an investment as they may or may not be replicated. Those considering this stock should seek independent financial advice.
Not only do the fundamentals look unattractive, but balance sheet stress is a possible issue, and there is little room to move if the medium term copper price comes under renewed pressure.
Sandfire Resources
Sandfire Resources (ASX: SFR) is the other option for investors looking for a relatively large (market capitalisation: circa $1 billion) Australian based copper gold producer. The company is just emerging from the capital intensive period of developing and optimising the DeGrussa project located in Western Australia.
However, because the company has been generating strong production while continuing with the development of the project it has been able to deliver four consecutive years of profitability. In recent years the focus has tended to be on the development side of the company’s operations, and it could be argued that this impressive performance is at times overlooked.
Chairman, Derek La Ferla recently pointed to the company’s strong long-term performance in saying, “It is worth pausing to note that the DeGrussa operation has now produced more than 285,000 tonnes of copper and 160,000 ounces of gold since mining commenced, generating total revenues exceeding $2 billion and consistently and reliably delivering clean, high-quality copper concentrates to our global customer base”.
David Coates from Bell Potter ran the ruler across SFR at the end of October following the release of the group’s September quarter production figures. He noted that production was slightly lower in the first quarter as previously guided by SFR and that the company was on track to meet guidance as outlined below.
The following data highlights SFR’s achievements in the four years to June 30, 2016, as well as providing guidance for fiscal 2017. Note the sizeable margin expansion that is occurring with the copper price now in the vicinity of US$2.60 per pound, implying a US$1.60 per pound premium above cash operating costs.
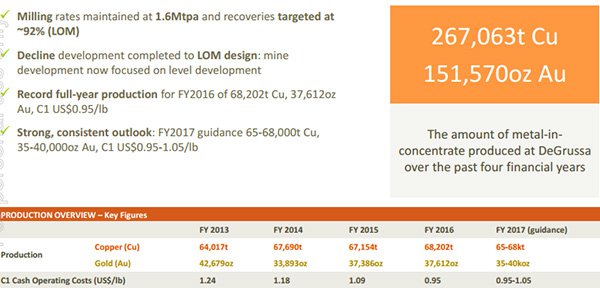
Coates is forecasting annual copper production to remain in a range between 62,000 tonnes and 66,000 tonnes between 2017 and 2019 inclusive. During the same period he expects gold production to taper slightly to 30,000 ounces in 2019.
Based on these assumptions, he expects a fiscal 2017 net profit of $64 million, representing earnings per share of 41 cents which would imply year-on-year growth of 33%. Another strong year of earnings growth is forecast in fiscal 2018 with earnings per share expected to increase by 44% to 59 cents.
This implies a PE multiple of 10.4, suggesting the company represents good value on a price-earnings to growth (PEG) basis.
Metals X
Metals X (MLX) is in the midst of a demerger which will see its strong portfolio of gold assets spun off into Westgold Resources, while its diversified tin, copper, nickel and cobalt businesses will be retained under the Metals X banner.
The following provides a snapshot of the gold assets which will be part of the Westgold portfolio.
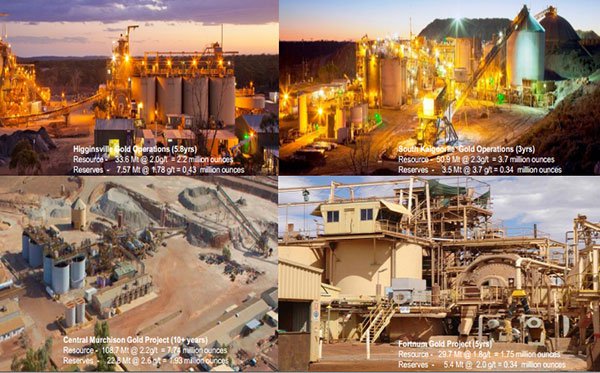
The decision to split the businesses has been considered for some time, but developments in the last 12 months have made the decision a compelling one.
During this period the company has significantly expanded its portfolio of gold projects and at same time acquired the Aditya Birla (ABY) Nifty copper operation which should be producing in the vicinity of 22,000 tonnes (in concentrate) per annum between 2017 and 2019 inclusive.
From a longer term perspective, MLX expects it will increase copper production to 30,000 tonnes per annum. The company has development ready projects in both tin and copper, and management recently highlighted the fact that cash flow from existing operations in these commodities will assist in bringing new projects into production.
Based on current reserves the Nifty copper operation has a mine life of between five and six years. However, there is the prospect of bringing the near development Maroochydore project on stream which could potentially produce ore for processing at the Nifty plant.
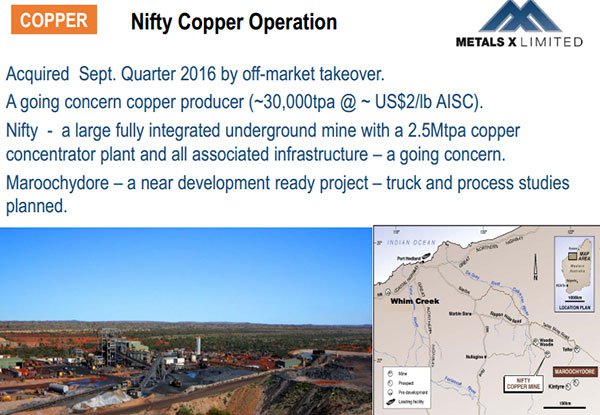
The financial metrics at Nifty stack up well with all in sustaining costs in the vicinity of US$2.00 per pound. It is worth bearing in mind that copper only fell below the US$2.00 per pound mark for a brief few days at the start of 2016, and even as the GFC unfolded it only took six months to rebound above US$2.00, which represented the start of a run which would see it more than double in price by 2011.
Notably, Metals X is the only listed tin producer in the Western world, producing 3500 tonnes per annum from its Renison project at margins in the vicinity of $10,000 per tonne at current prices.
With all in sustaining costs of $16,500 per tonne after copper credits, the tin price would have to fall substantially to make the project economically unviable. Importantly, Renison has reserves of more than 21 million tonnes, equating to an 11 year mine life with the prospect of further expansion.
Finders Resources
Finders Resources (ASX: FND) Wetar copper project is located in Indonesia. Most of the hard work in terms of building the 25,000 tonnes per annum copper cathode plant has been done.
Furthermore, the project is fully permitted and financed with a US$162 million senior debt facility and US$45 million project level equity. The company also raised $12 million through a placement at 12 cents per share in November.
While this was below the current trading price, the long-term benefits of being funded to drill out the existing resource and develop other targets on Wetar Island, suggest it was the right move.
The Wetar project has an initial mine life of approximately 10 years with average feed grade being 2.4% copper. The project is a low-cost operation and arguably one of the key attractions is the high margins it generates in the 18 month payback period based on the prevailing copper price.
While Finders’ share price experienced short-term weakness in response to the placement, it has for the best part recovered and is trading in the vicinity of 16 cents. This is close to the near two-year high of 19 cents struck in mid-July and given that the 12 month consensus price target is 30 cents there could be scope for further upside.
Importantly, Finders was gaining ground when the share prices of most of its peers were plunging in response to a declining copper price. This could explain why investors have gravitated towards oversold stocks in the sector. However, eventually FND should find support based on its attractive fundamentals.
Andrew Clayton from Euroz ran the ruler across the stock in mid-October. He has a buy recommendation on the company with a 12 month price target of 30 cents (analysts at Canaccord also rate FND as a buy with the same price target).
Historical data in terms of earnings performance and/or share trading patterns should not be used as the basis for an investment as they may or may not be replicated. Those considering this stock should seek independent financial advice.
Clayton is forecasting FND to generate a net profit of $35 million in fiscal 2017, representing earnings per share of 4.5 cents. This implies a PE multiple of less than four relative to the company’s recent trading range.
However, as the projections relating to commodity price sensitivity demonstrate below, a US$2.50 per pound copper price delivers a net profit of $40 million, while only a moderate push up from current levels to US$2.70 per pound should see the company generate a profit of circa $45 million.
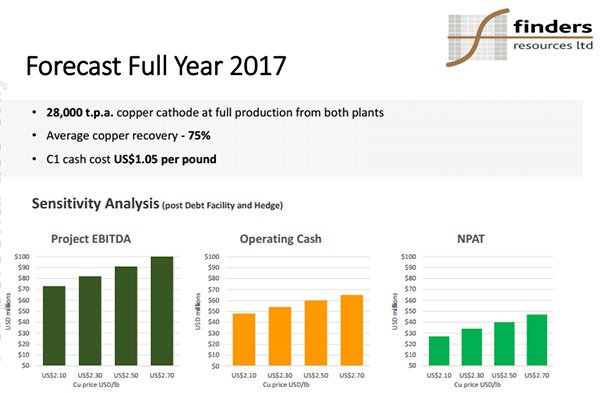
Substantial profit growth is forecast in fiscal 2018 as the Wetar project moves to full capacity, making the company look all the more attractive on fundamentals.
FND has been successfully selling copper cathode into nearby Indonesian markets, allowing it to realise robust margins, which will only look better if the copper price extends beyond broker assumptions.
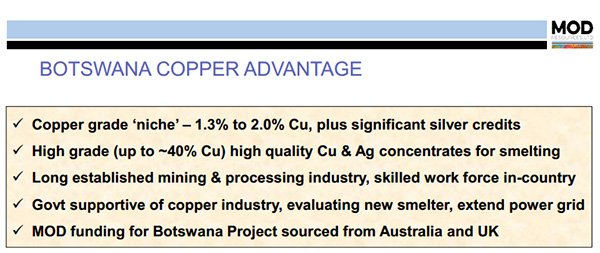
MOD Resources
The little-known minnow, MOD Resources (ASX: MOD), came under the spotlight in March after the company encountered early success in the course of its drilling campaign at T3, a copper project located in Botswana.
The company has a substantial holding in the highly prospective Kalahari Copper Belt region with 25 licenses totalling more than 11,000 square kilometres.
MOD has a joint venture with AIM listed Metal Tiger Plc (30%) which includes the T3 copper/silver deposit where a discovery RC drill hole intersected 52 metres grading 2% copper and 32 grams per tonne silver from a shallow depth in March 2016.
In September, the company announced a maiden resource of 28.36 million tonnes grading 1.24% copper and 15.7 grams per tonne silver, containing approximately 350,000 tonnes of copper and 14 million ounces of silver. The fact that the company was able to establish a resource in such a short period of time is a credit to management.
MOD is currently conducting a scoping study for a potential open pit mining operation at T3. This study is evaluating the potential for a 9 to 10 year mine life with an initial 2 million tonnes per annum processing plant on-site, the results of which are expected to be announced in November, potentially providing share price momentum.
Importantly, MOD is no stranger to this region and management has a good understanding of the geology. The group has been active in that region since 2011 and discovered the Corner K deposit, now renamed Mahumo copper/silver deposit.
The subsequently defined resource is currently the highest grade copper resource in the Kalahari Copper Belt and is the basis for MOD’s underground mining scoping study.
Mahumo remains completely open below the limit of drilling along a 2.4 kilometre strike length and stage 2 drilling is proposed to test for extensions to a circa 600 metre depth, commencing in the December quarter of 2016.
Stepping back to March, MOD announced the significant discovery of moderate to high grade copper/silver mineralisation intersected in drilling at shallow depths at T3. This resulted in the company’s share price surging from .004 cents to a 12 month high of 4.9 cents.
The rerating occurred under extremely high volumes including 100 million shares traded on the day the news was announced. There was another surge in August on the back of further exploration results which saw its shares more than double to hit a high of 6.2 cents.
However, they have retraced over the last three months, perhaps presenting a useful entry point, particularly if the scoping study proves to be a positive catalyst.
Again, share trading patterns should not be used as the basis for an investment as they may or may not be replicated. Those considering this stock should seek independent financial advice.
Analysts at Patersons have a high opinion of management which is headed up by Julian Hanna who oversaw the discoveries of Flying Fox and Spotted Quoll for Western Areas (ASX: WSA). The broker has a speculative buy recommendation on the company.
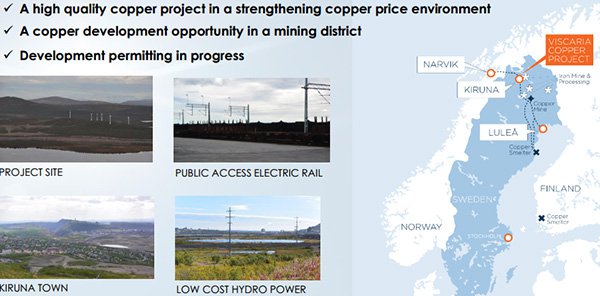
Avalon Minerals
There are similarities between MOD and Avalon Minerals (ASX: AVI) in that both companies have concessions in regions that have historically yielded outstanding copper production.
However, AVI is an early stage play for which investors should seek professional financial advice if considering for the company for their portfolio.
Prior mining activity makes interesting reading in that 12.5 million tonnes of sulphide ore was extracted at an average grade of 2.3% copper between 1982 and 1997, producing 300,000 tonnes of copper in concentrate.
Importantly, concentrate from this area has a history of being ‘clean’, and as a result was well sought after by European smelters. It is likely that this is still the case and with prominent industrial hubs on its doorstep there is the potential for AVI to sell concentrate into nearby markets in Europe.
Hartleys analyst John Macdonald recently flagged AVI as an emerging ‘copper play to watch’ with the prospect of the group establish an 8 to 10 year mine plan following an extensive drilling campaign in 2017 which is likely to total 15,000 metres.
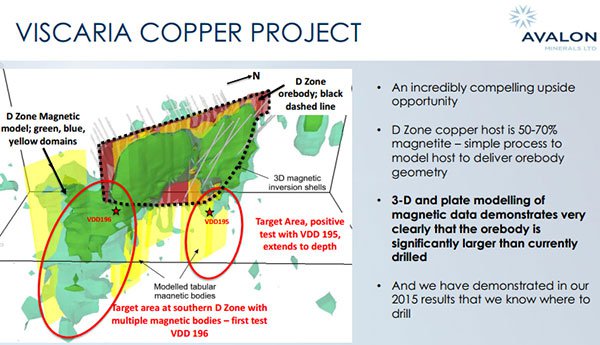
Macdonald noted that since 2008, Avalon’s drilling has highlighted the project’s potential. He highlighted that some of the deeper D zone intercepts show widths and grades reminiscent of the A zone proper, and successive scoping studies suggest a 20,000 tonnes per annum project as bankable at US$2.75 per pound copper.
A scoping study conducted in 2015 demonstrated the viability of the project with the potential to establish a 2 million tonnes per annum operation.
Drilling completed in 2015 strongly outperformed historical results with returns including 26.7 metres grading 2.6% copper, including 6.6 metres at 3.5% copper.
The scoping study was based on life of mine all in sustaining costs of US$2.10 per pound. Consequently, if the copper price were to push up towards US$3.00 per pound the project economics would be compelling.
Based on these metrics, analysts at Breakaway Research placed a speculative buy recommendation on the stock with a base case medium-term price target of 12 cents per share, implying upside of more than 400% to AVI’s current price.
However, the updated scoping study which should be completed by the second half of 2017 is likely to have a stronger focus on an expanded level of production at cheaper costs, potentially leading to improved margins and return on capital.
Management painted a scenario earlier this year which pointed to the establishment of a 2 million tonnes per annum operation with an initial nine year mine life and the capacity to deliver more than 20,000 tonnes of copper in concentrate per annum.
Based on these metrics AVI said the target internal rate of return was more than 25% with payback anticipated in less than four years based on all in sustaining costs of less than US$2.00 per pound.
If AVI can expand the resource and confirm the viability of such a project it could prompt a significant share price rerating.
As indicated below, drilling conducted outside the area of the mineral resource estimate has demonstrated that there is a high probability that the copper ore body extends well beyond the parameters that were the target of early stage exploration.
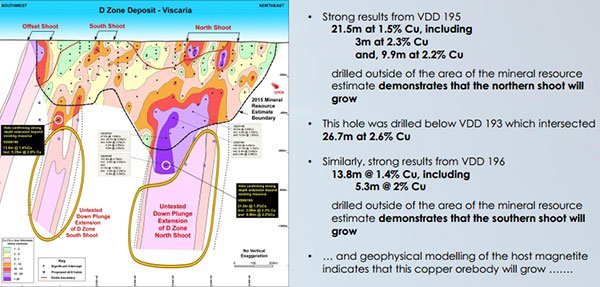
Because of the recent focus on the company’s gold and lithium assets, Viscaria appears to have slipped off the radar.
However, the importance of developing a copper project hasn’t been lost in the lithium/electric vehicle thematic, as management highlighted at the start of 2016 that a conventional car contains 15 kilograms of copper on average, while hybrid cars contain between 30 kilograms and 40 kilograms and a full electric vehicle requires 60 kilograms.
Consequently, AVI sees just as much benefit in developing its further progressed Viscaria project as it does in pursuing possible lithium projects.
There is the potential for a quick path to production in a region that offers all of the supporting infrastructure required including low-cost hydropower and local equipment manufacturers and contractors. Close proximity to major road, rail, and port facilities is another factor working in the project’s favour.
There is much to consider here in terms of copper and copper stocks, but there is more to come as later in the week we look at zinc, followed by nickel.
General Information Only
S3 Consortium Pty Ltd (S3, ‘we’, ‘us’, ‘our’) (CAR No. 433913) is a corporate authorised representative of LeMessurier Securities Pty Ltd (AFSL No. 296877). The information contained in this article is general information and is for informational purposes only. Any advice is general advice only. Any advice contained in this article does not constitute personal advice and S3 has not taken into consideration your personal objectives, financial situation or needs. Please seek your own independent professional advice before making any financial investment decision. Those persons acting upon information contained in this article do so entirely at their own risk.
Conflicts of Interest Notice
S3 and its associated entities may hold investments in companies featured in its articles, including through being paid in the securities of the companies we provide commentary on. We disclose the securities held in relation to a particular company that we provide commentary on. Refer to our Disclosure Policy for information on our self-imposed trading blackouts, hold conditions and de-risking (sell conditions) which seek to mitigate against any potential conflicts of interest.
Publication Notice and Disclaimer
The information contained in this article is current as at the publication date. At the time of publishing, the information contained in this article is based on sources which are available in the public domain that we consider to be reliable, and our own analysis of those sources. The views of the author may not reflect the views of the AFSL holder. Any decision by you to purchase securities in the companies featured in this article should be done so after you have sought your own independent professional advice regarding this information and made your own inquiries as to the validity of any information in this article.
Any forward-looking statements contained in this article are not guarantees or predictions of future performance, and involve known and unknown risks, uncertainties and other factors, many of which are beyond our control, and which may cause actual results or performance of companies featured to differ materially from those expressed in the statements contained in this article. S3 cannot and does not give any assurance that the results or performance expressed or implied by any forward-looking statements contained in this article will actually occur and readers are cautioned not to put undue reliance on forward-looking statements.
This article may include references to our past investing performance. Past performance is not a reliable indicator of our future investing performance.