
Gain some leverage to South Korean growth machine through iShares IKO
Published 08-JUN-2017 23:02 P.M.
|
5 minute read
Hey! Looks like you have stumbled on the section of our website where we have archived articles from our old business model.
In 2019 the original founding team returned to run Next Investors, we changed our business model to only write about stocks we carefully research and are invested in for the long term.
The below articles were written under our previous business model. We have kept these articles online here for your reference.
Our new mission is to build a high performing ASX micro cap investment portfolio and share our research, analysis and investment strategy with our readers.
Click Here to View Latest Articles
It is difficult to identify another six month period when so many major global indices have notched up significant milestones in terms of setting all-time records or breaking above long-term highs.
The arrival of President Trump was the catalyst for a surge in the US stock market as it increased from circa 18,000 points around election time in November to blast through the 20,000 point mark for the first time in history in January, and then quickly went on to post record highs of more than 21,000 points between March and June, only last week eclipsing the 21,200 point mark.
Of course it should be remembered that share trading patterns should not be used as the basis for an investment as they may or may not be replicated. Those considering this stock should seek independent financial advice.
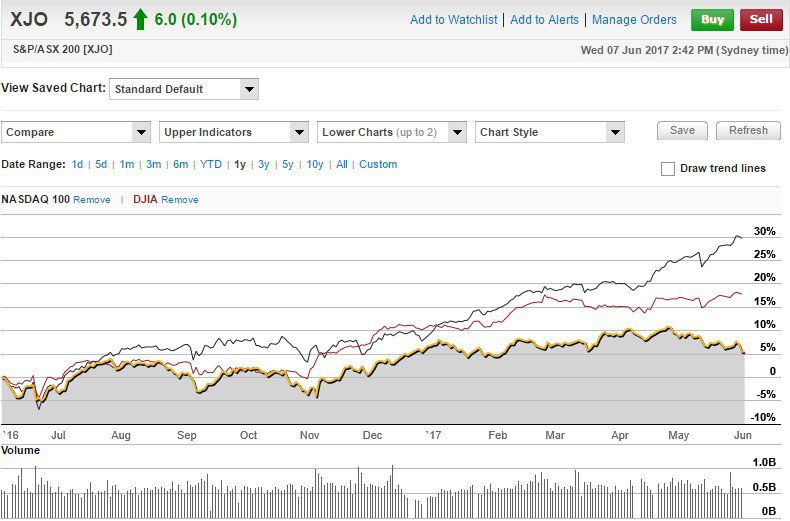
The substantial outperformance of the US indices against the S&P/ASX 200 (XJO) over the last six months can be seen in the following chart. In particular, note the stunning outperformance by the tech heavy NASDAQ compared with both the Dow and the XJO.
That is worth keeping in mind as we later examine the prospects of investing in the South Korean sharemarket.
European markets not to be outdone
European markets have followed suit with the negative response to Brexit now a distant past. The FTSE 100 hit the magic 7200 point mark in January, and has gone on to notch up new records on a regular basis, only last week going within a whisker of 7600 points.
Similarly, the German DAX broke through its previous record high of 12,400 points in April, and last Friday notched up another record high of 12,879 points before closing at 12,823 points. Strong PMI numbers from the manufacturing powerhouse suggest it may have more upside to come.
The presidential election was extremely favourable for French equity markets reflected in the Paris CAC 40’s run from circa 5000 points in mid-April to a recent high of approximately 5440 points, a level it hasn’t traded at since the global financial crisis.
Asian markets follow suit but South Korea is the sleeping giant
It was only last week that Japan’s benchmark index, the NIKKEI broke through 20,000 points for the first time in 18 months. However, there is the possibility of it hitting an even more important milestone should it break through the 21,000 point mark for the first time in history.
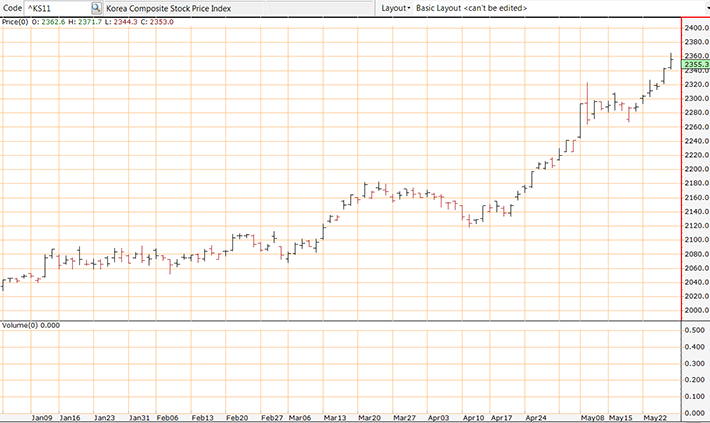
Given this backdrop, it is perhaps understandable that many market commentators have missed the outstanding performance of the South Korean KOSPI Composite Index which only in May broke above a long-term high of circa 2220 points to quickly hit 2323 points, representing an all-time record.
As can be seen from the chart below, it quickly consolidated in the 2300 point range before surging again towards the end of May and early June to post another record high of 2376 points.
South Korea has a good mix of industry exposure with tech giants such as Samsung, a thriving auto manufacturing sector and a shipbuilding industry that is the envy of many first world countries.
In fact, over the last decade South Korea has been a major supplier of both defence vessels and container ships, and its success, as well as its expertise in this area has been well documented.
The following video is worth viewing as it demonstrates what a relatively small country can achieve as it built what at that stage was the world’s largest ship.
How to get exposure to the burgeoning South Korean economy
So if South Korea is the sleeping giant how do Australian investors get a piece of the action?
It isn’t easy to target individual stocks and invest on a regular basis, and those wishing to do should seek professional financial advice and make the necessary arrangements through a stockbroker.
For those that wish to take a positive view on the country’s overall performance, it may be worth considering iShares MSCI South Korea Capped Index Fund which is an Exchange Traded Fund (ETF) seeking to provide investment results that correspond to the price and yield performance of publicly traded securities in the South Korean market.
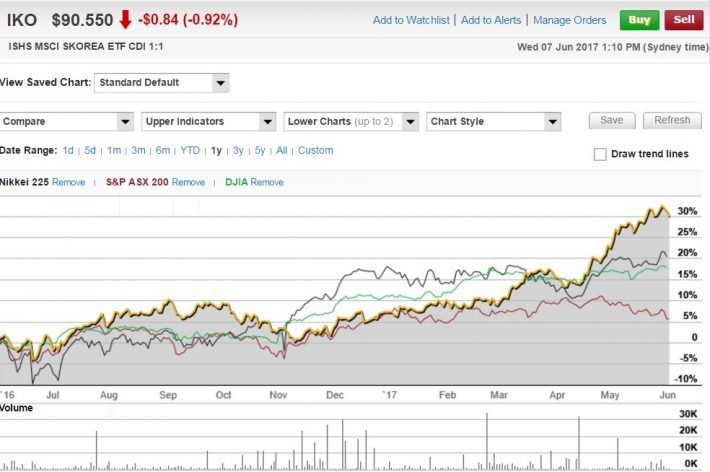
Shares trade under the ASX code IKO and the fund is managed by high profile BlackRock Fund Advisors. As can be seen below, the ETF has substantially outperformed the Dow Jones index, the XJO and fellow Japanese Asian index, the NIKKEI.
It is currently trading close to its 12 month and all-time high of AUD$92.58, having closed at $90.20 on Wednesday, June 7.
The past performance of the indices in this article are not and should not be taken as an indication of future performance. Caution should be exercised in assessing past performance. This product, like all other financial products, is subject to market forces and unpredictable events that may adversely affect future performance.
In terms of stock exposure, Samsung Electronics accounts for 24% of the portfolio. However, other companies in the top 10 provide more of a balance with the likes of Hyundai Motor (3%), global steelmaking giant, POSCO (2.73%) and the leading tobacco company in South Korea, KT&G (1.6%) some of the top 10 holdings.
Again, it should be noted that share trading patterns should not be used as the basis for an investment as they may or may not be replicated.
From an overall perspective, the allocation of funds by sector is as follows.
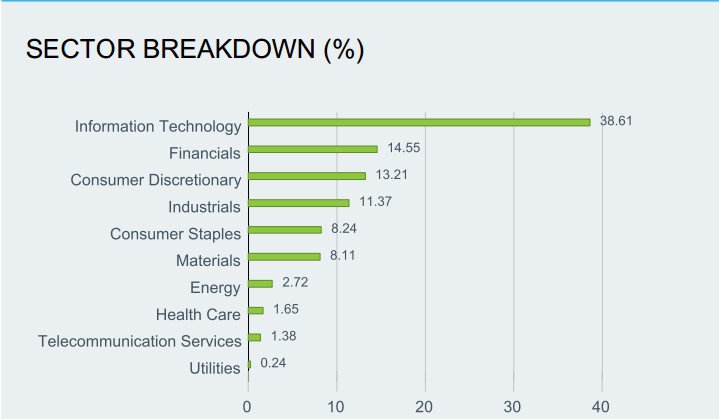
While there is a heavy skew towards the IT sector it is worth remembering the outperformance of the NASDAQ which we referred to earlier. If investors are on the mark in targeting the IT sector as the place to be for the future this should augur well for IKO.
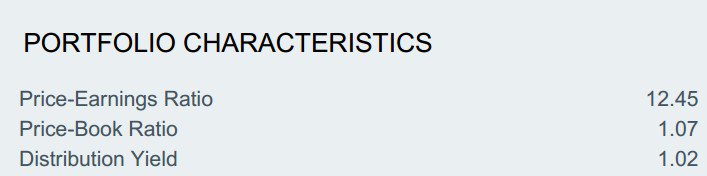
The following provides a basic insight into the fundamentals of the portfolio. Note the average price-earnings ratio is well below the average price-earnings ratios applicable to markets such as the US.
In particular, large NASDAQ listed IT companies would trade on far more demanding multiples.
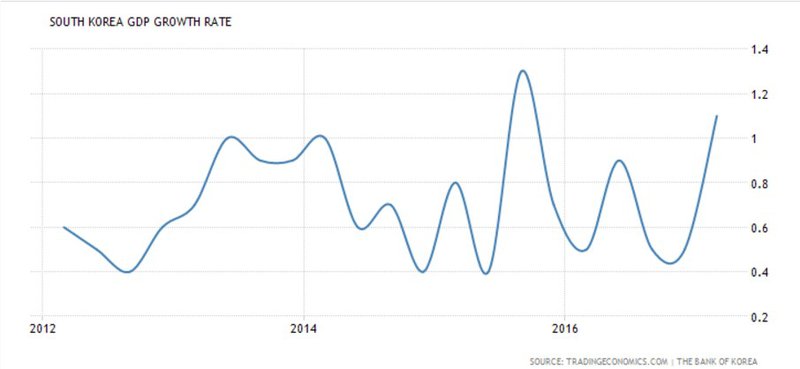
The South Korean economy is going through a purple patch having recently delivered March quarter GDP growth of 1.1%, higher than consensus expectations of 0.9%.
This was one of the best performances over the last five years, and from a production perspective, faster growth was attributed to across-the-board improvements in manufacturing as well as a significant uptick in the construction industry.
For investors looking to gain exposure to markets outside of Australia and in particular target emerging economies IKO may be worth considering.
General Information Only
S3 Consortium Pty Ltd (S3, ‘we’, ‘us’, ‘our’) (CAR No. 433913) is a corporate authorised representative of LeMessurier Securities Pty Ltd (AFSL No. 296877). The information contained in this article is general information and is for informational purposes only. Any advice is general advice only. Any advice contained in this article does not constitute personal advice and S3 has not taken into consideration your personal objectives, financial situation or needs. Please seek your own independent professional advice before making any financial investment decision. Those persons acting upon information contained in this article do so entirely at their own risk.
Conflicts of Interest Notice
S3 and its associated entities may hold investments in companies featured in its articles, including through being paid in the securities of the companies we provide commentary on. We disclose the securities held in relation to a particular company that we provide commentary on. Refer to our Disclosure Policy for information on our self-imposed trading blackouts, hold conditions and de-risking (sell conditions) which seek to mitigate against any potential conflicts of interest.
Publication Notice and Disclaimer
The information contained in this article is current as at the publication date. At the time of publishing, the information contained in this article is based on sources which are available in the public domain that we consider to be reliable, and our own analysis of those sources. The views of the author may not reflect the views of the AFSL holder. Any decision by you to purchase securities in the companies featured in this article should be done so after you have sought your own independent professional advice regarding this information and made your own inquiries as to the validity of any information in this article.
Any forward-looking statements contained in this article are not guarantees or predictions of future performance, and involve known and unknown risks, uncertainties and other factors, many of which are beyond our control, and which may cause actual results or performance of companies featured to differ materially from those expressed in the statements contained in this article. S3 cannot and does not give any assurance that the results or performance expressed or implied by any forward-looking statements contained in this article will actually occur and readers are cautioned not to put undue reliance on forward-looking statements.
This article may include references to our past investing performance. Past performance is not a reliable indicator of our future investing performance.