
Building a portfolio around residential construction trends
Published 22-SEP-2016 10:24 A.M.
|
24 minute read
Hey! Looks like you have stumbled on the section of our website where we have archived articles from our old business model.
In 2019 the original founding team returned to run Next Investors, we changed our business model to only write about stocks we carefully research and are invested in for the long term.
The below articles were written under our previous business model. We have kept these articles online here for your reference.
Our new mission is to build a high performing ASX micro cap investment portfolio and share our research, analysis and investment strategy with our readers.
Click Here to View Latest Articles
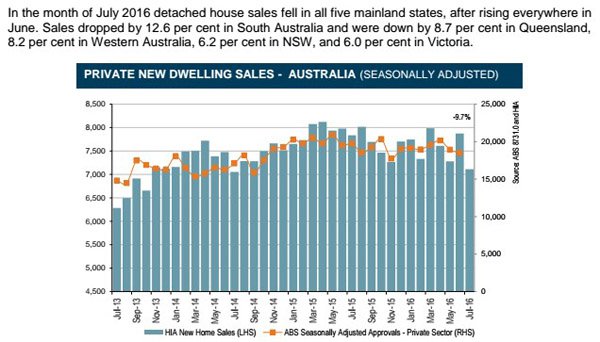
The recent release of housing data prompted a sombre statement from Housing industry Association (HIA) chief economist, Dr Harley Dale.
Responding specifically to the significant fall in new home sales Dale said, “New home construction has been the kingmaker of the Australian economy, but the cycle has peaked”.
Indeed, a sharp step up in activity in the residential housing sector in recent years played an important role in supporting the broader construction industry and the economy generally, assisting in the recovery from a post GFC hangover.
While Dale’s comments could be interpreted as somewhat alarming, headline new home sales numbers were to some extent conflicting, prompting the need to drill down through the data to identify potential investment opportunities and areas of risk.

Further emphasising the need to delve deeper regarding the health of the construction sector was the fact that on the day following the release of new home sales data, positive new building approvals data prompted Dale to say, “A stellar rise of 23.4% in approvals for other dwellings in July 2016 took the new building approvals component within a whisker of its cyclical peak of 11,572 reached in May 2015”.
There is no questioning the fact that there was a mix of negative data, but what bodes well for investors is that generally speaking there was a broad-based sell-off in stocks exposed to the housing construction industry, potentially providing renewed value for diligent stock pickers in a sector that had arguably run ahead of itself.
Diligence is the key here and investors in this space should seek professional financial advice before making an investment decision with regard to this sector.
What definitely can be said is that it is far too early to make a call that the Australian economy’s kingmaker is dead.
What was the data
As well as data regarding new home sales (Tuesday) and building approvals (Wednesday), both for the month of July, the other interesting statistics released on Thursday related to retail sales.
Residential housing activity is often an accurate lead indicator in terms of consumer purchasing in areas such as hardware, furniture, homewares and white goods.

Of course the most immediate response in terms of equities fluctuations tends to be felt in the building materials sector because of the potential near-term flow on effects given that they are involved in the first stage of building projects.
It is also significant that most building materials companies such as Adelaide Brighton, Boral and James Hardie Industries are in the top 100, usually resulting in their closely monitored share prices moving swiftly.
As an indication of the market’s broader response, shares in Adelaide Brighton fell nearly 10% from circa $5.50 to trade in the vicinity of $5.00, while Boral and James Hardie Industries shed approximately 4%.
The latter generates significant income from outside of Australia, insulating its exposure to domestic trends.
Sifting through the numbers
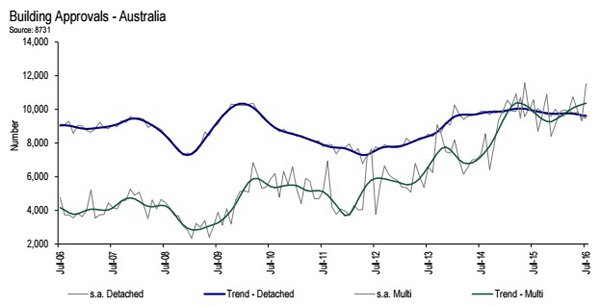
The above chart representing the Australian Bureau of Statistics data for July 2016 building approvals doesn’t tell the whole story.
As highlighted by Dale, activity was mixed in terms of geographic region and industry segments. He noted that the sharp 27.8% seasonally adjusted increase in new home building approvals in New South Wales was largely driven by multiunit construction.
However, the fact remains that the New South Wales market remains buoyant, and the 12.8% increase in Queensland’s seasonally adjusted new home building approvals indicates that the region is also in good shape.
Furthermore, Victoria was only down marginally, and perhaps tempering the negative underlying tones projected by this data, it was the Victorian and New South Wales markets that proved to be most resilient in relation to the HIA new home sales data shown below.
This suggests it may be appropriate to focus on property developers and providers of building materials, fixtures and fittings, consumables and capital goods to East Coast markets.
With this in mind, Finfeed provides an overview of 30 companies, some which better fit the stronger themes we have highlighted, but we also look at industry participants that have other attributes which could bring them into contention as potential investment prospects.
This has proven timely given that reporting season has just concluded with many of the companies we are reviewing having provided outlook statements. Furthermore, more than half of them have been recently reassessed by analysts as their results have come to hand.
Property developers
Looking at identifying companies with exposure to the residential construction sector from the ground up the natural place to start is with property developers. While there are a number of companies that fit this mould in the S&P/ASX 100 most of these are Real Estate Investment Trusts (REITs) which tend to diversify their portfolios across a range of property types outside the residential sector.
Consequently, we are focusing on pure residential plays. However, it is worth noting a recent research report released by Macquarie Wealth Management on the listed property sector pointed to Mirvac Group as one of only a small number of companies that carried an outperform recommendation.
The broker noted that Mirvac Group (ASX: MGR) had one of the best results of the reporting season with less than 1% non-settlement on apartments and a fiscal 2017 outlook ahead of expectations due to higher residential volumes and cost outs. Furthermore, the broker said the company’s earnings visibility was high considering that of its $2.9 billion in residential pre-sales, 50% were expected to settle in fiscal 2017.
While the companies we examine are far smaller than Mirvac, most have delivered strong earnings performances in fiscal 2016 with a number providing promising outlook statements in August. It is also worth noting that some of these companies tend to fly under the radar, often resulting in value that can’t be found among the blue chips.
Yet finding that value can be difficult and if again if considering this sector or companies within this sector for your investment portfolio, it is imperative to seek professional financial advice.
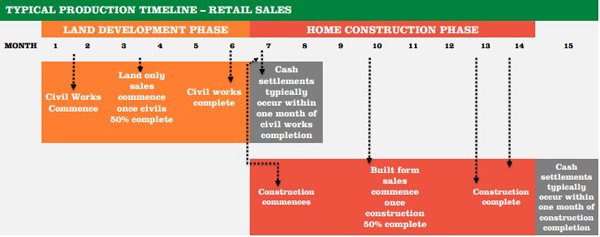
One aspect that is important to understand is that industry participants stand to benefit at differing parts of the cycle depending on the products and services they provide. For example, a company such as Adelaide Brighton which earns a substantial amount of income from the sale of cement generates revenue at the beginning of the cycle as slabs are poured.
In contrast, a company such as GWA Group which distributes products such as kitchen and bathroom fittings will recognise income at the end of the cycle. The following provides a reasonable indication of how revenue recognition occurs from contract signing to house completion.
AV Jennings
AV Jennings (ASX:AVJ) is a leading residential property development company that has been established for more than 80 years. The company’s focus has traditionally been to provide affordable housing with the added attraction of developing whole communities which assists in marketing their homes as part of a residential/lifestyle package.
To achieve this goal the group has targeted fringe suburban areas that offer infrastructure such as transport, shopping and essential services, effectively ensuring that homeowners aren’t disadvantaged in comparison with those living in more expensive city and fringe CBD locations.
Once again, it comes back to affordability and by employing this strategy AVJ is able to operate as a high-volume builder with economies of scale that come with the bulk purchasing of materials.
This was evident in the company’s fiscal 2016 result which featured revenue and profit growth of 32.7% and 22% respectively. Earnings per share increased 18.6% to 10.7 cents and consensus forecasts point to a similar result in fiscal 2017, implying a PE multiple of 6.5 relative to its recent trading range of 70 cents.
In running the ruler across AVJ’s fiscal 2016 result, Jonathan Snape from Bell Potter upgraded fiscal 2017 and 2018 earnings per share by 16.1% and 13.7% respectively and said, “After a period of trading at a substantial discount relative to its peers, AVJ has begun to close this gap but still trades at a 23% discount to net tangible asset value and it has the lowest fiscal 2017 PE multiple within its peers”.
The consensus 12 month price target is 78 cents, implying upside of more than 10%.
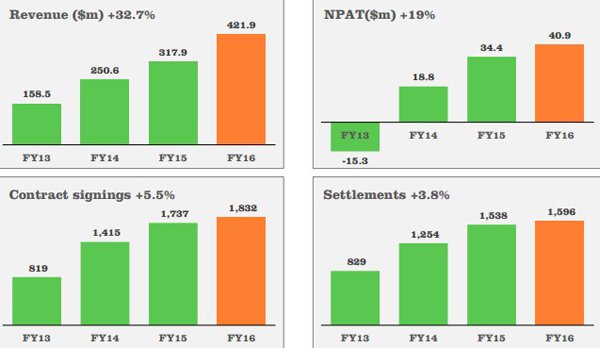
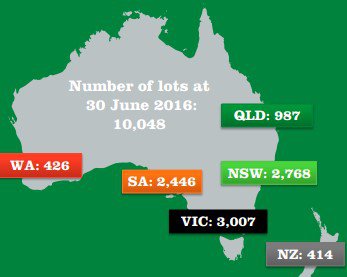
Assessing the group’s outlook, it has a strong balance sheet with gearing of less than 20%. This provides management with the option of building on its land bank which currently stands at approximately 10,000 lots.
Both contract signings and settlements were up on the previous year with the former providing earnings visibility into fiscal 2017 as settlements occur and revenues are recognised.
The company is well positioned in terms of its geographic exposure with quality projects in Sydney, the central New South Wales coast, Gold Coast hinterland and Caloundra on the Sunshine Coast. This provides it with exposure to a mix of first home buyers and the ageing population with the latter looking to downsize and move to popular retirement destinations.
Management’s strategy of targeting fringe suburban areas with proximity to the CBD is evident in its push into the South Australian market where it is well-positioned to progress projects in the northern corridor leading into Adelaide proper.
Cedar Woods Properties
Cedar Woods Properties (ASX: CWP) is one of the largest ASX listed specialist residential property developers with a market capitalisation of circa $400 million.
The Perth-based group foresaw the benefits of diversifying outside Western Australia nearly 10 years ago when it started the development of the Williams Landing project in Victoria.
Within 12 months the company had sold more than 200 lots and since then the fringe suburban estate has been developed into a residential environment which one could liken to a satellite city of Melbourne.
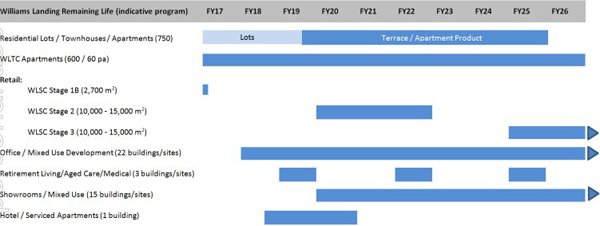
As indicated below Williams Landing remains a substantial growth driver for Cedar Woods with the development of houses, townhouses and apartments expected to extend at least out to 2026.
The company has strung together 10 consecutive years of profitability and since developing the Williams Landing project net profit has increased from less than $10 million to more than $40 million.
CWP delivered a net profit of $43.6 million in fiscal 2016 and management expects to at least match that in the coming 12 months. However, the company has traditionally under promised and outperformed and it wouldn’t be surprising to see further profit growth achieved in fiscal 2017.
However, even a like-for-like performance would see the company generate earnings per share of circa 55 cents, implying a PE multiple of approximately nine relative to its current trading range.
The company also shapes up as an attractive yield proposition with the forecast fiscal 2017 dividend of 29.5 cents implying a return of 5.9%.
Macquarie Wealth Management noted the strength of the company’s balance sheet in reviewing its fiscal 2016 result, and the broker maintained its outperform recommendation on the basis that industry conditions were reasonable and return on equity was solid at 14%.
With conservative gearing of 16% and interest cover of 16 times CWP has plenty of head room to execute on its development program with large projects underway in Queensland, Victoria and Western Australia. It will also provide management with opportunities in terms of achieving its goal of expanding the group’s position in the Melbourne market through acquisitions.
The company enters fiscal 2017 with robust pre-sales of $184 million, representing an increase of 20% compared with the previous corresponding period.
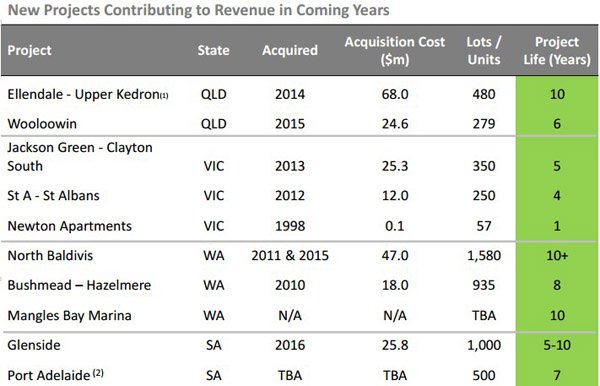
As well as having a strong near-term outlook CWP has projects with terms of 10 years or more in Queensland, Western Australia and South Australia. Consequently, not only has it been delivering strong shareholder returns over the last 10 years, but it has established a robust asset base with more than 5000 lots/units primed for development in coming years.
Finbar Group
While it has been proven over time that the apartment industry is more volatile than housing, specialist apartment developer, Finbar Group (ASX: FRI) shouldn’t be discarded.
The company has performed well through various cycles as can be seen below and even though its operations are focused on the relatively depressed Western Australian market it could be argued that the potential downside from this exposure is more than factored into its share price.
The company was a market darling between 2012 and 2014 as its share price doubled from circa 90 cents to hit an all-time high of $1.80, but it has since retraced to recently trade as low as 78 cents.
This is representative of the fluctuations that may occur in the market as a whole and why caution and professional financial advice is required when considering any company as an investment option.
It would appear that investors have failed to look through the headline numbers achieved in fiscal 2016 which reflected a net profit of $8 million after investment property valuation impairments.
However, underlying operating profit was $21 million and the company finished with a cash position of $28 million to fund its extensive development program fiscal 2017 and beyond.
Importantly, FRI achieved record pre-sale levels of $451 million in fiscal 2017 representing a year-on-year increase of 11%. Consequently, the company could suit medium-term contrarian investors looking at entering the stock at a relatively cheap price.
It is also worth noting the group’s project pipeline of $2.2 billion, boosted significantly in fiscal 2016 after receiving development approvals for seven new projects. The company has taken advantage of subdued land values to provide a platform for growth as the industry recovers.
As most good companies do when conditions are challenging, management took the decision to strengthen its market share as competitors fell by the wayside.
Management provided some interesting commentary regarding the sales environment saying, “Whilst the fiscal 2016 market conditions saw reduced investment buyer activity, our sales activity across all projects is reflective of a growing sophistication within the Perth property market and an increasing level of demand from owner occupiers”.
This is a good sign for Finbar as it is the owner occupier market that provides stability. The company has always targeted prime locations close to the CBD for inner-city dwellers or in close proximity to well sought after beach precincts that are relatively close to Perth.
Sunland Group
Sunland Group’s fiscal 2016 net profit of $31.5 million represented year-on-year growth of 5%, and was well in excess of the mid-range of management’s guidance, which was $27.5 million.
The result also caught brokers by surprise with Fiona Buchanan from Morgans CIMB noting the operating profit of $34.1 million was significantly ahead of her expectations of $30.3 million.
Buchanan subsequently upgraded her profit forecast for fiscal 2017 by 20%, saying that near-term earnings will be supported by 16 active projects across Queensland, New South Wales and Victoria with a further nine projects to be launched in fiscal 2017.
Not surprisingly, the quality of the result triggered a rerating with its shares increasing from approximately $1.50 to nearly $1.70. However, the stock has recently gone ex-dividend and its shares are now trading in the vicinity of $1.55.
This represents a sharp discount to the 12 month consensus price target of $2.24, which appears well within the company’s grasp given it implies a PE multiple of 11.3 relative to the group’s fiscal 2016 earnings.
While management won’t be providing quantitative guidance until the AGM in November, the outlook statement certainly appeared promising with the group having a diversified portfolio valued at $4.3 billion.
With regard to the group’s geographic positioning it has a significant focus on the south-east Queensland market with quality landholdings and projects in progress in highly sought after areas that are aligned with trends such as fringe CBD dwelling and the sea change/lifestyle market.
Such is the strength of Sunland’s portfolio that the company’s net tangible assets per share currently stand at $2.22, further highlighting what would appear to be a share price that reflects a sizeable discount to fair value.
The company has a strong position in the multi-storey market which remain robust in inner-city areas and retirement destinations. Consequently, investors looking to maintain some exposure to the apartment market could see Sunland Group as an option.
Tamawood
While Tamawood (ASX: TWD) is smaller than most of its peers with a market capitalisation of approximately $90 million, it is by no means a small player in the market and has been established for more than 20 years.
However, it tends to fly under the radar despite having some interesting points of difference. By its own admission, TWD sees itself as a ‘systems company’ rather than just a homebuilder.
On this note it likens itself to franchise groups such as Flight Centre and Harvey Norman as its growth and market penetration is driven by the rollout of its Dixon Homes franchises.
The group claims to have been the first to create architect inspired and designed homes using a replicable, profitable, deliverable and marketable system and this has seen it have considerable success in targeting the affordable housing market.
Today the company is looking to extend that competitive edge by developing the Resiweb enterprise software which is owned by unlisted Resiweb Ltd, with TWD having a 23.4% stake in the company.

The software is expected to be commercially available in fiscal 2017, and management expects this will assist in driving the growth of its franchising business, as well as providing productivity gains within the group’s overall operations.
From a financial perspective, TWD delivered a strong performance in fiscal 2016 with net profit increasing from $6.4 million in the previous period to $8 million, representing earnings per share of 31.5 cents, implying growth of 25.5%.
The company finished fiscal 2016 debt free with $2.5 million in cash. The coming year is shaping up as promising given the company has significant exposure to the south-east Queensland market which generated substantial growth in fiscal 2016.
Management also expects expansion of its New South Wales operations in Port Macquarie, Newcastle and Illawarra with the expectation that this will drive revenue growth in fiscal 2017.
Although this is speculative at this stage and should not form the basis of any investment decision relating to this stock, so seek professional financial advice for further information.
Villa World
Villa World (ASX:VLW) delivered a strong fiscal 2016 result with its pre-tax profit of $47.2 million exceeding guidance of $46.6 million and representing year-on-year growth of 60%.
Reflecting on the result, Scott Murdoch from Morgans CIMB noted that the company was trading on a fiscal 2017 PE multiple of 8 and that his forecast dividend for that period of 19 cents per share implies a dividend yield of 7.5%.
This prompted Murdoch to increase his price target from $2.54 to $2.71 while also upgrading earnings per share forecasts for fiscal years 2018 and 2019.
Murdoch highlighted that the company’s promising outlook for fiscal 2017 was supported by pre-sales of $165 million, representing an increase of 24% compared with the previous corresponding period.
In the last 12 months the company acquired 2139 lots including the purchase of three sizeable projects in south-east Queensland which management expects will provide product continuity over the next 4 to 6 years.

VLW has benefited from its strong exposure to the South-East Queensland market with bayside estates and the Brisbane-Gold Coast corridor accounting for sales of 28% and 17% respectively.
Projects in Victoria accounted for 26% of group sales and management indicated that the company’s land estates continued to sell strongly in Melbourne.
Management highlighted the company’s robust operating cash flows of $131.5 million and said that with ample head room in its bank facility the company was well-positioned to acquire new land.
Retirement and Lifestyle
While some of the property developers we have already covered tap into the retirement and lifestyle thematic, investors who are looking for a pure play is in this area could consider the three stocks examined below. It is worth noting that these companies aren’t so much looking to cash in on the ageing population theme as is the case with the likes of service providers to the aged care industry.
It could be argued these companies have a cleaner outlook with less exposure to regulatory conditions that surround aged care services.
One only has to look at the share price performances of Japara Healthcare, Estia Health and Regis Healthcare to get a feel for conditions in the troubled sector. Their share prices are all at least 40% off their 12 month highs, and shares in Estia Health for example have fallen from $7.84 to a low of $2.18 in the last 12 months.
However, even the performances of the following three stocks have been mixed and those looking for exposure to the lifestyle/retirement sector may be better off looking for a diversified play such as Sunland Group.
Gateway Lifestyle Group
The below expectations fiscal 2016 performance of Gateway Lifestyle Group (ASX:GTY) demonstrates the degree of volatility within the sector. One of the key factors to bear in mind is that the growth these companies are seeking for the best part needs to be driven by acquisitions or greenfield investments.
Consequently, there is pressure on management to correctly value asset acquisitions and take a measured approach to the development of new sites in order to maximise returns on income invested. GTY has good exposure to East Coast markets and management said it is actively reviewing new opportunities in that region.
While GTY generally delivered on guidance, it was the outlook statement which concerned some analysts. Macquarie Wealth Management said, “There was limited explanation of the assumptions around the fiscal 2017 guidance other than Gateway has closed five parks to bring forward redevelopment at a cost of approximately $2 million to annual rental”.
The broker said it had previously assumed 11% growth in settlements in fiscal 2017. This would imply settlements of 292 compared with management’s guidance of 275.
GTY’s shares plunged nearly 20% when the company released its fiscal 2016 result at the end of August. The current trading range of circa $2.30 is well shy of the 12 month high of $3.07.
However, until management demonstrates that the business is in better shape operationally and financially there is unlikely to be any significant share price upside. This is perhaps borne out in Macquarie Wealth Management’s take on the stock.
Following the result the broker downgraded its earnings per share forecasts for fiscal years 2017 and 2018 by 13.7% and 17.9% respectively. It also lowered its recommendation to neutral and reduced the price target from $2.94 to $2.40.
This highlights the fluctuating nature of the markets and why it is important to always take a cautious approach to investing, no matter, what the stock, and seek professional financial advice.
Ingenia Communities Group
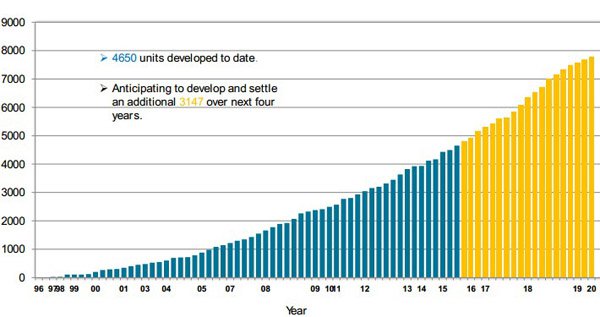
Ingenia Communities Group (ASX: INA) delivered underlying profit growth of 20% in fiscal 2016 and the result also featured strong operating cash flow of $21 million.
Revenue growth of 41% was driven by impressive sales execution with 107 new home settlements more than double the previous corresponding period.
Laying the foundation for near to medium-term growth was the exchange of contracts for a 229 home greenfield site in Port Stephens, north of Newcastle. Development approval has already been ratified for this project.
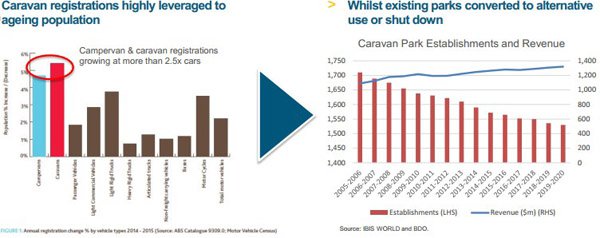
From a macro perspective, management noted that tourism park demand is increasing while supply is reducing as can be seen from the data below.
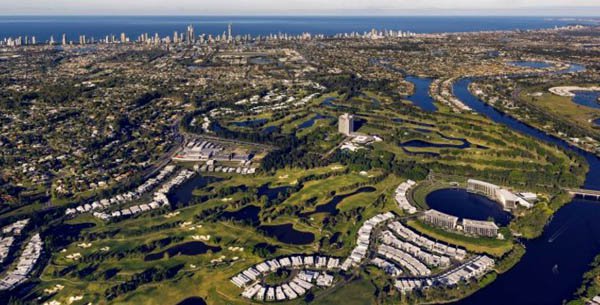
Chief executive, Simon Owen, highlighted that in the last few years INA has acquired some of the most iconic tourism and mixed use parks in Sydney and coastal New South Wales. The company’s focus on coastal locations where retirees can have the dual benefits of cheaper accommodation due to the smaller sized housing, as well as access to luxury lifestyle environments is paying dividends.
Looking to the future, Owen said, “INA continues to refine its strategy as the market for affordable seniors housing matures and evolves”.
On this note he said, “INA is now contracting or optioning attractive large-scale, high-quality greenfield opportunities which will support multi-year projects offering strong development margins and high sales volumes”.
INA is forecasting new home settlements in excess of 150 in fiscal 2017.
While Josephine Little from Morgans CIMB lowered earnings per share estimates for fiscal years 2017 and 2018 by 7% and 14.9% respectively due to her assumed costs and net interest and lower tax benefits in future years, she maintained an add recommendation with a price target of $3.10, implying upside of approximately 10% to the company’s recent trading range.
Based on Little’s fiscal 2017 forecasts, INA is trading on a PE multiple of 18.5, seemingly a stretch given compound annual earnings per share growth of 12% is forecast over the next three years.
However, the underlying macro environment in INA’s target market is robust and this could see the company outperform expectations in the medium term.
Lifestyle Communities
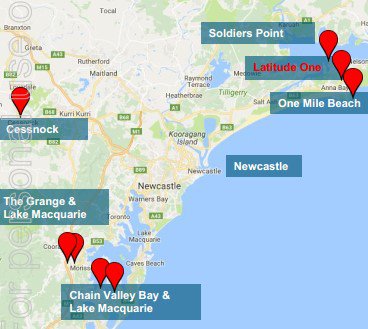
Lifestyle Communities (ASX: LIC) also focuses on developing communities with affordable accommodation in attractive locations that have a tourist destination element.
Most of LIC’s housing communities are located in attractive locations and management is cognisant of the demand from retirees to live in idyllic settings evidenced by the fairly recent acquisitions of two new sites located on Melbourne’s Mornington Peninsula and Ocean Grove which is situated on and the Bellarine Peninsula.
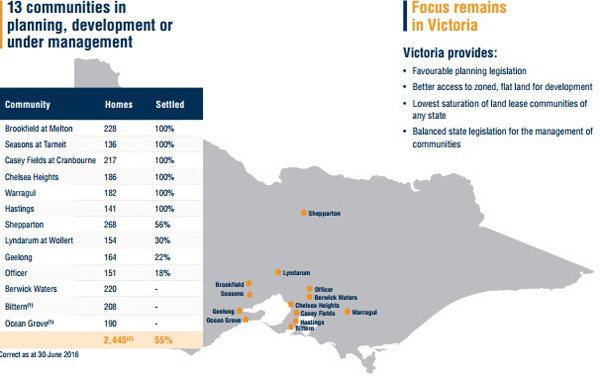
All of the company’s properties are located in Victoria and management has indicated its preference for that state. The company is attracted to the favourable planning legislation in place and ready access to zoned, flat land. Management also highlighted that Victoria has the lowest saturation of land lease communities of any state.
Its property portfolio is highlighted below.
Analysts responded positively to the group’s fiscal 2016 result and this was evidenced in upgraded consensus forecasts for fiscal years 2017 and 2018.
The company’s fundamentals appear more attractive than its peers, trading on forward PE multiples of 15.3 and 13.7 relative to consensus forecasts for fiscal years 2017 and 2018 respectively.
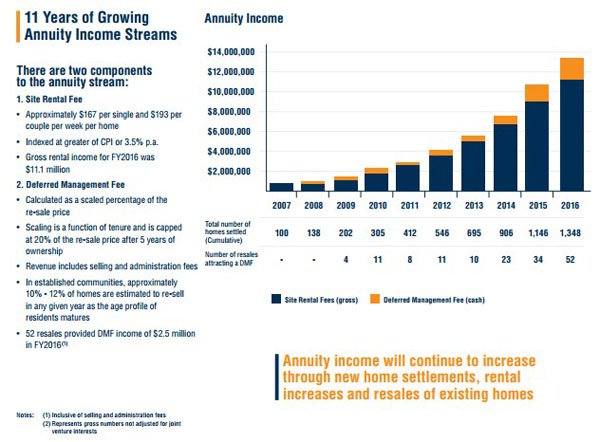
Another important factor to bear in mind is LIC’s considerable proportion of recurring annuity income that is generated by site rental fees and deferred management fees. This provides both earnings visibility and a degree of insulation against cyclical trends which can result in lumpy earnings patterns.
As can be seen in the table below, annuity income has been increasing strongly over the last 10 years and this trend will continue as new homes are settled, existing houses are resold and CPI linked rent increases are realised.
Broker projections may not be met and investors should seek professional financial investment advice. Further to this, previous trading patterns are not an indication of future share price movements, and as such shouldn’t be used as a basis for investment. Seek professional financial advice for any investment decision.
In our next segment on stocks leveraged to the residential construction industry we will examine providers of building materials such as cement, bricks and tiles, as well as companies that specialise in fixtures and fittings such as glass, plumbing products and kitchen and bathroom wares.
General Information Only
S3 Consortium Pty Ltd (S3, ‘we’, ‘us’, ‘our’) (CAR No. 433913) is a corporate authorised representative of LeMessurier Securities Pty Ltd (AFSL No. 296877). The information contained in this article is general information and is for informational purposes only. Any advice is general advice only. Any advice contained in this article does not constitute personal advice and S3 has not taken into consideration your personal objectives, financial situation or needs. Please seek your own independent professional advice before making any financial investment decision. Those persons acting upon information contained in this article do so entirely at their own risk.
Conflicts of Interest Notice
S3 and its associated entities may hold investments in companies featured in its articles, including through being paid in the securities of the companies we provide commentary on. We disclose the securities held in relation to a particular company that we provide commentary on. Refer to our Disclosure Policy for information on our self-imposed trading blackouts, hold conditions and de-risking (sell conditions) which seek to mitigate against any potential conflicts of interest.
Publication Notice and Disclaimer
The information contained in this article is current as at the publication date. At the time of publishing, the information contained in this article is based on sources which are available in the public domain that we consider to be reliable, and our own analysis of those sources. The views of the author may not reflect the views of the AFSL holder. Any decision by you to purchase securities in the companies featured in this article should be done so after you have sought your own independent professional advice regarding this information and made your own inquiries as to the validity of any information in this article.
Any forward-looking statements contained in this article are not guarantees or predictions of future performance, and involve known and unknown risks, uncertainties and other factors, many of which are beyond our control, and which may cause actual results or performance of companies featured to differ materially from those expressed in the statements contained in this article. S3 cannot and does not give any assurance that the results or performance expressed or implied by any forward-looking statements contained in this article will actually occur and readers are cautioned not to put undue reliance on forward-looking statements.
This article may include references to our past investing performance. Past performance is not a reliable indicator of our future investing performance.