
2020 market outlook: Brace for impact
Published 18-DEC-2019 09:47 A.M.
|
6 minute read
Hey! Looks like you have stumbled on the section of our website where we have archived articles from our old business model.
In 2019 the original founding team returned to run Next Investors, we changed our business model to only write about stocks we carefully research and are invested in for the long term.
The below articles were written under our previous business model. We have kept these articles online here for your reference.
Our new mission is to build a high performing ASX micro cap investment portfolio and share our research, analysis and investment strategy with our readers.
Click Here to View Latest Articles
December 21, 2018 marked a two-year low for the S&P/ASX 200 (ASX:XJO), but it also represented the inflection point for one of the best rallies experienced by the index in terms of the size of the rerating and the virtually uninterrupted run that saw it increase from 5467 points to 6845 points on July 30, 2019, implying a gain of more than 25%.
Of course, July 30 also marked the start of a significant downturn with the XJO plunging to about 6400 points in a fortnight.
However, since then we have seen a gradual recovery, and the index went close to touching the 6900 points mark in late November.
This week started on a high with the XJO up about 120 points or 1.8% on Monday afternoon, prompting market commentators to question whether the magic 7000 point mark could be reached before year-end.
A key driver on Monday was the consummation of a trade deal between US and China that investors had been hoping for.
After trade tensions have undermined markets, particularly in the second half of 2019, this was top of the Christmas gift list for all of those invested in the stock market.
US markets responded accordingly on Monday (Monday evening Australian time) with the S&P 500, Dow Jones index and the NASDAQ index all closing at record highs, and providing another strong lead for the Australian market on Tuesday.
This saw the XJO pass the 6870 point mark before closing at 6846 points.
‘’Trade deal appears more of a distraction than a transaction, suggesting all-time record highs across the Dow, NASDAQ and S&P 500 may be short-lived.’’
Trade deal remains flimsy
One couldn’t be blamed for postulating that the trade deal lacks substance and commitment, and perhaps was just a much-needed distraction from impeachment proceedings.
In essence, the trade deal is a ‘’phase I accord’’ which entails a partial rollback of some tariffs and the elimination of further US duties on Chinese imports that were due to take effect on Sunday.
With Trump in charge we could be only a tweet away from turning on a dime when it comes to geopolitical issues.
Of course, Trump brings further uncertainty in 2020 as impeachment proceedings continue.
‘’And as the November 3, 2020 presidential election draws closer, so will a sense of nervousness and market unpredictability.
‘’This can be a period when markets swing wildly as evidenced by the performance of the Dow Jones index leading up to and following the election of Trump as president.’’
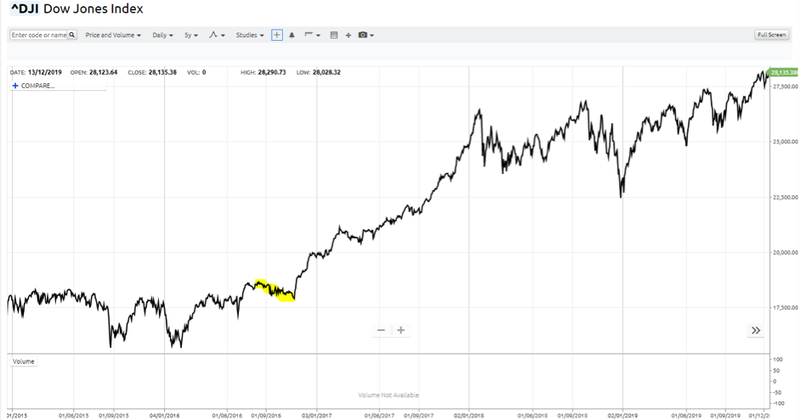
The timeframe highlighted in yellow is the three months leading up to the election when the Dow slumped from more than 18,600 points to a low of about 17,800 points just days before the election.
Incredibly, financial markets immediately turned bullish as the Trump administration prevailed with the Dow Jones index making a virtually uninterrupted run from just over 18,000 points on election day to peak at around 26,600 points in January 2018, a gain of nearly 50%.
As a measure of election related volatility, the gold price told the story in graphic fashion.
After closing at US$1275 per ounce on the day prior to the election, it hit a high of US$1337 per ounce (up US$62 per ounce) on election day before closing virtually unchanged as Trump won the day.
Always a good barometer in terms of measuring the health of the financial environment, gold had slumped to US$1150 per ounce within a month of Trump’s election, a vote of confidence in his ability to restore the US economy.
‘’While the phenomenal swings in markets makes for interesting reading, in terms of equities investing in 2020 I believe the key takeaway is that we are in for a year of extreme volatility.’’
Volatility index experiences a number of spikes
The CBOE Volatility Index (VIX) has proven to be an accurate measure of volatility, and the following five-year chart distinctly shows that there have been few periods since September 2018 where the index has reflected a sense of stability.
The black line represents the 50 day simple moving average (SMA) which has generally trended downwards from about December 18, 2014 to currently hover in the vicinity of 12.
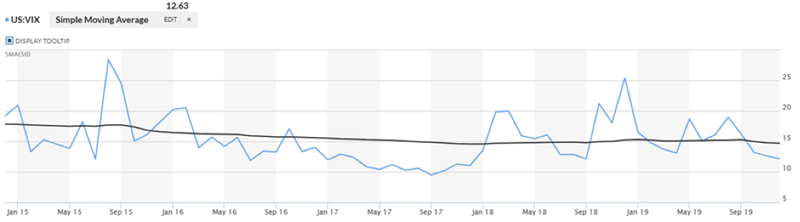
However, note the spike to 17 points in the actual index (blue line) around election time (either side of September 2016).
If you cast your eyes forward now to September 2018 you will see some surges to 21 points in October 2018, followed by 25 points in December 2018.
The other prominent feature since the retracement from 25 points is the amount of time that the blue line has spent above the simple moving average, indicative of a volatile environment.
Consequently, despite the bullish market mood this index is showing frequent periods of volatility in what may be the calm before the storm.
‘’A combination of impeachment proceedings, the presidential election, as well as the seemingly overstretched valuations that are implied at this stage of the bull market leaves virtually no room for further upside, and a huge chasm if sentiment turns.’’
Implications for Australian equities markets
The last time the XJO traded at these heady levels, it was the bubble about to burst as the global financial crisis unleashed its fury across all markets and other asset classes such as property which was particularly affected in the US due to undisciplined lending practices.
This chart illustrates the spooky similarities between the here and now and where we were some 10 or so years ago as the GFC unfolded following a similar share price surge.
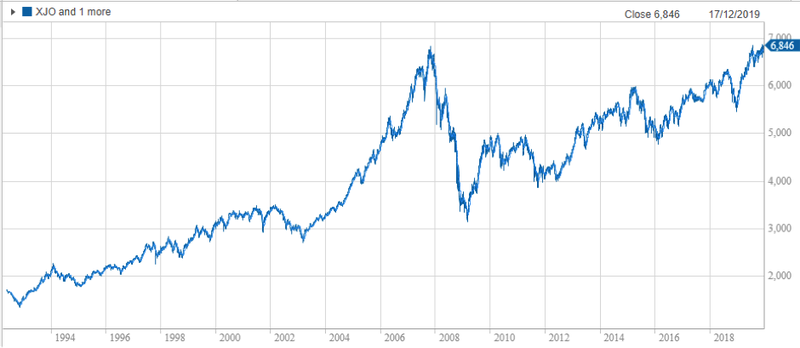
The XJO broke above the GFC high around mid-year, and as you can see it tended to stabilise in a range between 6500 points and 6700 points over the last six months with only slight short-lived breaks above and below that range.
The following chart makes for interesting reading in terms of drawing on history to speculate on the chances of a sizeable correction in 2020.
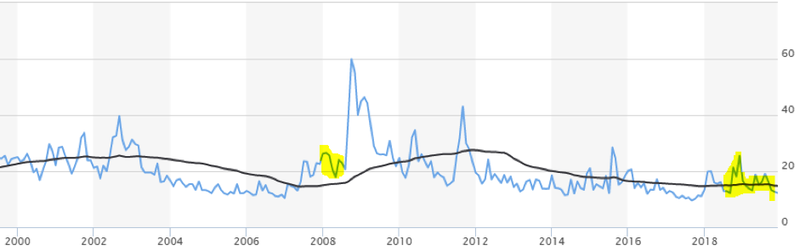
There was a blip and dip in the volatility index in 2007/2008 just prior to the spike where it hits the 60 point mark.
In the part shaded in yellow on the left, the volatility index hit 26 points and then retraced to 17 points before the start of that sharp upward trend.
Looking to the right we see a couple of blips to 25 points and then 20 points leading up to the recent retracement to around 12 points.
Whether this is the dip before the spike remains to be seen, but I’m banking on a period of sustained volatility in 2020 resulting in a downturn in global equities markets.
‘’In such an environment I want a share portfolio that is diversified by sector with a skew towards blue-chip stocks with robust balance sheets and a definite bias towards companies that generate income through the sale and provision of products and services that are difficult for businesses and consumers to live without.Companies with strong competitive positions and unmatched proprietary technologies in niche markets generally demonstrate resilience even in tough times.’’
Tomorrow I will be putting together a portfolio of stocks, choosing one company from each sector, as well as a couple of sub-sectors in order to achieve more extensive diversification.
General Information Only
S3 Consortium Pty Ltd (S3, ‘we’, ‘us’, ‘our’) (CAR No. 433913) is a corporate authorised representative of LeMessurier Securities Pty Ltd (AFSL No. 296877). The information contained in this article is general information and is for informational purposes only. Any advice is general advice only. Any advice contained in this article does not constitute personal advice and S3 has not taken into consideration your personal objectives, financial situation or needs. Please seek your own independent professional advice before making any financial investment decision. Those persons acting upon information contained in this article do so entirely at their own risk.
Conflicts of Interest Notice
S3 and its associated entities may hold investments in companies featured in its articles, including through being paid in the securities of the companies we provide commentary on. We disclose the securities held in relation to a particular company that we provide commentary on. Refer to our Disclosure Policy for information on our self-imposed trading blackouts, hold conditions and de-risking (sell conditions) which seek to mitigate against any potential conflicts of interest.
Publication Notice and Disclaimer
The information contained in this article is current as at the publication date. At the time of publishing, the information contained in this article is based on sources which are available in the public domain that we consider to be reliable, and our own analysis of those sources. The views of the author may not reflect the views of the AFSL holder. Any decision by you to purchase securities in the companies featured in this article should be done so after you have sought your own independent professional advice regarding this information and made your own inquiries as to the validity of any information in this article.
Any forward-looking statements contained in this article are not guarantees or predictions of future performance, and involve known and unknown risks, uncertainties and other factors, many of which are beyond our control, and which may cause actual results or performance of companies featured to differ materially from those expressed in the statements contained in this article. S3 cannot and does not give any assurance that the results or performance expressed or implied by any forward-looking statements contained in this article will actually occur and readers are cautioned not to put undue reliance on forward-looking statements.
This article may include references to our past investing performance. Past performance is not a reliable indicator of our future investing performance.