Look beyond the gold price part 2: Gold-copper projects outperform pure gold plays
Published 06-AUG-2020 09:37 A.M.
|
5 minute read
Hey! Looks like you have stumbled on the section of our website where we have archived articles from our old business model.
In 2019 the original founding team returned to run Next Investors, we changed our business model to only write about stocks we carefully research and are invested in for the long term.
The below articles were written under our previous business model. We have kept these articles online here for your reference.
Our new mission is to build a high performing ASX micro cap investment portfolio and share our research, analysis and investment strategy with our readers.
Click Here to View Latest Articles
While the gold price is soaring, we discussed yesterday that there are many other factors that feed into a company’s operations that go towards determining the extent to which they can benefit from these boom times.
For example, operational and financial metrics that can impact the bottom line include foreign exchange movements, costs of production, methods of mining (open pit versus underground), mineralisation grades and last but certainly not least, hedging.
The latter is a strategy undertaken by companies to lock in the sale of future production at a certain price.
In the current environment, many companies have locked in forward sales at prices well below the US$2000 per ounce mark.
However, as we discussed yesterday there are many metrics to take into account in terms of determining the timing and degree of impact on company earnings.
Setting aside those factors, in simple terms profitability comes down to deducting costs from revenues generated from sales to arrive at earnings, which to a large degree will determine a company’s fate.
Costs of production are referred to as all in sustaining costs (AISC), and as the table showed yesterday, these vary extensively.
However, I mentioned that there was one important factor that can considerably change the cost curve and boost company earnings.
Copper credits substantially reduce the cost of production
This relates to the mineralisation being mined, and while many gold mines simply produce gold, there are others that produce metals such as silver and copper in combination with gold.
In Australia we have some of the best gold-copper mines in the world where the production of large quantities of copper drives down the project’s AISC’s, as revenues from the sale of copper (copper credits) are deducted from production costs for the overall project.
The following example demonstrates the significant impact of a gold-copper operation as opposed to a pure gold project.
Importantly, this example compares mines owned and operated by Australia’s largest gold mining group, Newcrest Mining (ASX: NCM).
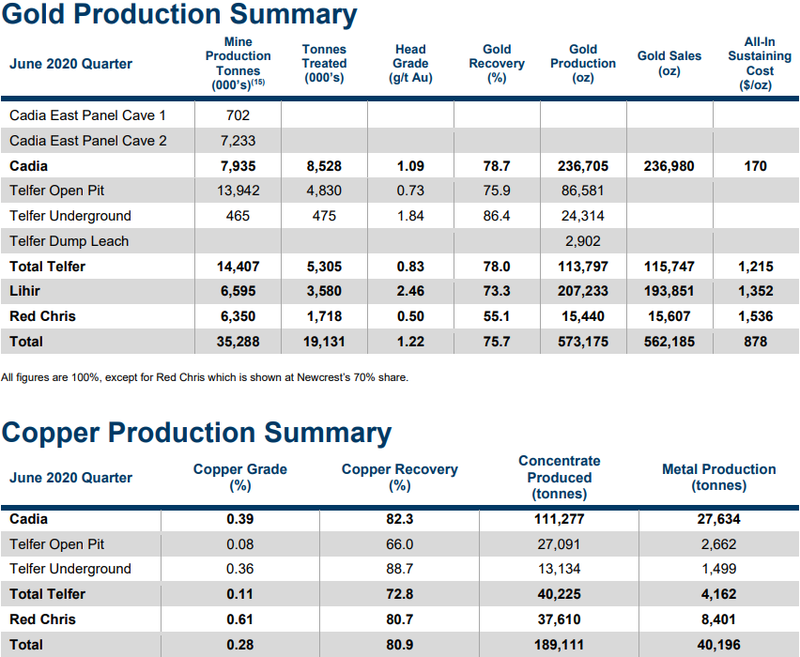
The gold production summary for the June 2020 quarter (top) shows that the group’s Cadia operations in New South Wales produced 236,705 ounces of gold at an AISC of $170 per ounce.
If you scan down the table you will see that another of Newcrest’s largest producing mines in Lihir produced 207,233 ounces of gold at an AISC of $1352 per ounce.
Much of this substantial gap between the costs of production can be attributed to the benefits Cadia receives from its significant copper production.
As the copper production summary shows, Cadia produced 27,634 tonnes of copper compared with zero copper production from Lihir.
Even Telfer had reasonable copper production of 4162 tonnes, but its AISC was well above Cadia at $1215 per ounce
The importance of taking into account copper credits and arguably sharpening your focus on gold-copper projects rather than pure gold projects is even more important at the moment because of the substantial increase in the copper price, something that appears to have slipped under the guard of many investors.
With all the focus on gold, and in particular, the extremely lucrative Australian dollar gold price, copper has been forgotten.
It needs to be remembered that Australian copper producers also benefit from the lower Australian dollar.
The following five-year chart shows copper’s performance in black (US dollar price in tonnes), with the green line denoting the value of the Australian dollar against the US dollar.
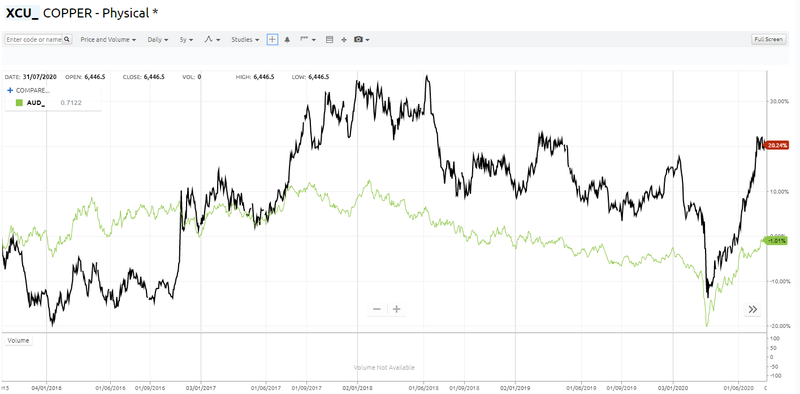
The copper price has rebounded strongly with the timing exactly in sync with broader equities markets.
It started its bounce from about US$4600 per tonne on 23 March and pushed through US$6500 per tonne about three weeks ago.
Copper has been hovering close to that mark since then with technical investors probably looking for a break above US$6550 per tonne to pave the way for the red metal to recapture the heady levels of more than US$7000 per tonne that it traded at in 2017/2018.
It pays to look at that period, as you will see that copper mainly traded in a range between about US$6600 per tonne and US$7200 per tonne during that period.
A snapshot of the same time frame shows that the Australian dollar fluctuated between US$0.75 and US$0.80.
Doing the sums on the mid-range of the copper price (US$6900 per tonne) and the Australian dollar (US$0.775) during this period, this equates to an Australian dollar copper price of $8900 per tonne.
Applying the current Australian dollar exchange rate of US$0.715, the Australian dollar copper price based on US$6500 per tonne is now approximately $9100 per tonne.
Consequently, there has been no better time in history where commodity prices and currency rates have aligned so perfectly for Australian based gold-copper miners.
The outperformance of gold-copper plays is reflected in the share price performance of one of the largest ASX listed groups in this space by size and production, Oz Minerals (ASX: OZL).
Looking at Oz Minerals on a standalone basis, its share price has increased from about $6.00 to $14.00 since March.
While Newcrest benefits from its gold-copper operations at some of its mines, Oz Minerals also has three large (and still growing) gold-copper project in Prominent Hill, Carrapateena and Carajás (Brazil).
It is worth noting that Carajás is located in South America where prolific gold-copper deposits have been developed over the years.
Carajás is in ramp-up phase, and with it also benefiting from foreign exchange metrics the project is likely to be a strong growth driver for Oz Minerals in coming years.
Tomorrow when we look at some emerging players we will focus on companies with projects in South America that have similar characteristics to Carajás.
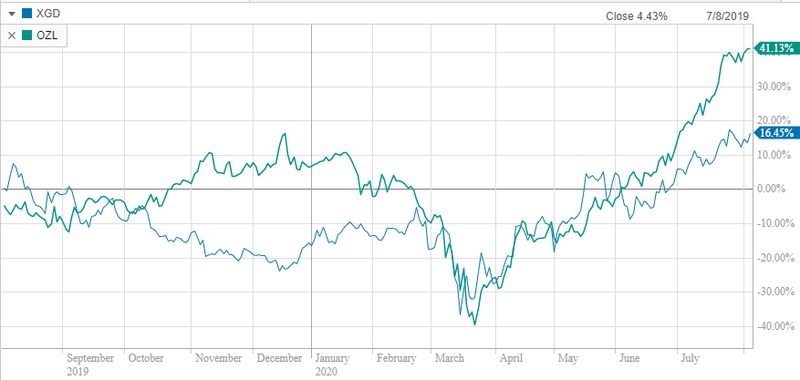
As indicated in the following chart, Oz Minerals has substantially outperformed the S&P/ASX All Ordinaries Gold Index (XGD) over the last 12 months.
Check in tomorrow for the ten next big things in this space.
General Information Only
This material has been prepared by StocksDigital. StocksDigital is an authorised representative (CAR 000433913) of 62 Consulting Pty Limited (ABN 88 664 809 303) (AFSL 548573).
This material is general advice only and is not an offer for the purchase or sale of any financial product or service. The material is not intended to provide you with personal financial or tax advice and does not take into account your personal objectives, financial situation or needs. Although we believe that the material is correct, no warranty of accuracy, reliability or completeness is given, except for liability under statute which cannot be excluded. Please note that past performance may not be indicative of future performance and that no guarantee of performance, the return of capital or a particular rate of return is given by 62C, StocksDigital, any of their related body corporates or any other person. To the maximum extent possible, 62C, StocksDigital, their related body corporates or any other person do not accept any liability for any statement in this material.
Conflicts of Interest Notice
S3 and its associated entities may hold investments in companies featured in its articles, including through being paid in the securities of the companies we provide commentary on. We disclose the securities held in relation to a particular company that we provide commentary on. Refer to our Disclosure Policy for information on our self-imposed trading blackouts, hold conditions and de-risking (sell conditions) which seek to mitigate against any potential conflicts of interest.
Publication Notice and Disclaimer
The information contained in this article is current as at the publication date. At the time of publishing, the information contained in this article is based on sources which are available in the public domain that we consider to be reliable, and our own analysis of those sources. The views of the author may not reflect the views of the AFSL holder. Any decision by you to purchase securities in the companies featured in this article should be done so after you have sought your own independent professional advice regarding this information and made your own inquiries as to the validity of any information in this article.
Any forward-looking statements contained in this article are not guarantees or predictions of future performance, and involve known and unknown risks, uncertainties and other factors, many of which are beyond our control, and which may cause actual results or performance of companies featured to differ materially from those expressed in the statements contained in this article. S3 cannot and does not give any assurance that the results or performance expressed or implied by any forward-looking statements contained in this article will actually occur and readers are cautioned not to put undue reliance on forward-looking statements.
This article may include references to our past investing performance. Past performance is not a reliable indicator of our future investing performance.