First batch of USA uranium drilling results beat expectations - more results due in coming weeks
Disclosure: The authors of this article and owners of Next Investors, S3 Consortium Pty Ltd, and associated entities, own 20,232,084 GTR shares and 746,615 GTR options at the time of publication. S3 Consortium Pty Ltd has been engaged by GTR to share our commentary on the progress of our investment in GTR over time.
10 down, 90 more to go.
Our investment GTi Resources (ASX:GTR) is currently in the middle of a maiden drilling program at its uranium project in the USA.
So far, drilling results have exceeded GTR’s expectations - this is after only 10 holes drilled, and another 90 more holes either in progress or still to be drilled.
GTR’s drilling is expected to be finished in the first few weeks of January - so we are hoping we can get some more progress updates from GTR over the coming weeks.
In this note we will explain why GTR are happy with results so far, and what we are looking for next.
Before we get stuck into the drill results, it's worth noting that GTR’s project is located in Wyoming's Great Divide Basin - a region of Wyoming that is home to 80% of US domestic uranium production.
It’s the same state that Bill Gates and Warren Buffet’s company Terra Power is building a next generation nuclear power plant.
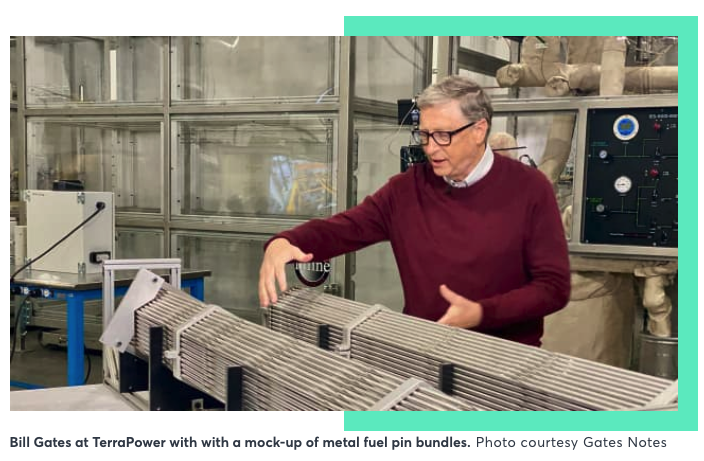
It's going to cost $4BN to build this next generation nuclear plant, and we think Bill is going to need to secure a lot more USA uranium sources over the coming decades.
Anyway - back to GTR.
GTR’s current uranium drilling program is largely designed off the back of historical drilling data, which is proving to be an excellent guide to the current drilling.
The programme is split across ~100 holes for a combined depth of 15,000m.
GTR is targeting uranium mineralisation that is amenable to In-Situ-Recovery (ISR) mining methods - considered the cheapest method of uranium mining.
With ISR deposits having low capital/operating costs, the focus is less on grades and more on the size of the overall deposit.
That’s why with GTR’s drilling results we are most interested in the Grade Thickness (GT) measure, which is a measure that combines grade and the size of an intercept to provide an indication of the overall size of the mineralised area.
Going into the drilling program, GTR set the overall target at a Grade Thickness measure of 0.2 with grades no less than 0.02% uranium.
Last week, GTR put out the results from the first 10 drill holes which highlighted a peak result of 8.4m @ 0.044% uranium for a GT of 1.92 and an average GT across these holes of 0.99.
An average GT of 0.99 is much higher than the minimum expectation of 0.2
So far so good, given GTR was looking for a GT of 0.2, and achieved an average of 0.99 - this almost 4 times more than what the company was hoping for.
GTR’s drilling program is currently tracking well above the expectations set pre-drilling.
What is the “ISR” uranium mining method?
ISR stands for “In Situ Recovery”, and ISR uranium mining is considered the lowest cost source of uranium globally.
The process involves pumping liquid into an orebody to dissolve the mineralised deposit and then using what is called the “leach” (recovery) process to pump the dissolved solution back to surface through a recovery well for processing.
You can check out an explainer video of how it works here.
The key point is there are no big open cut mines to dig up here.
The focus is less on grades and more on the overall size of the deposit.
This makes “Grade Thickness” the more important measure of whether or not an ISR deposit is economically viable.
Our thoughts on GTR’s drilling results so far
Sometimes drilling result announcements can seem like one big information dump - companies will often just put out the data with a brief explanation of the location of the drilling without any context.
This can create a short term bias where investors decide to buy or sell shares based on grades or intercept sizes.
As with all of our exploration investments we like to put context around drill result announcements, and generally with exploration it can be a marathon, not a sprint.
Companies need a few drill programmes to prove something up.
We mentioned in our last GTR note that we would be watching the drilling program closely to see what the results are indicating.
At the time GTR set some expectations for the current drilling program:
The main result to focus on is the Grade X Thickness (GT) figure which is the biggest determinant of whether or not GTR are onto something or not.
Last week GTR put out the results from the first 10 holes of the 100 hole program and we think the results received so far are good:
- 8.4m @ 0.044% Uranium for a GT of 1.92
- 7m @ 0.063% Uranium for a GT of 1.74
- Average GT over the first 10 holes of 0.99
GTR was aiming for a grade of at least 0.02% uranium and a GT of greater than 0.2, but the results far exceeded these expectations.
Now for some context behind these results.
GTR set these expectations based on the already producing nearby Lost Creek ISR Uranium deposit owned by the C$350M capped UR-Energy (TSE: URE).
You can see GTR’s Thor Claims on the map below, and how close they are to Lost Creek:
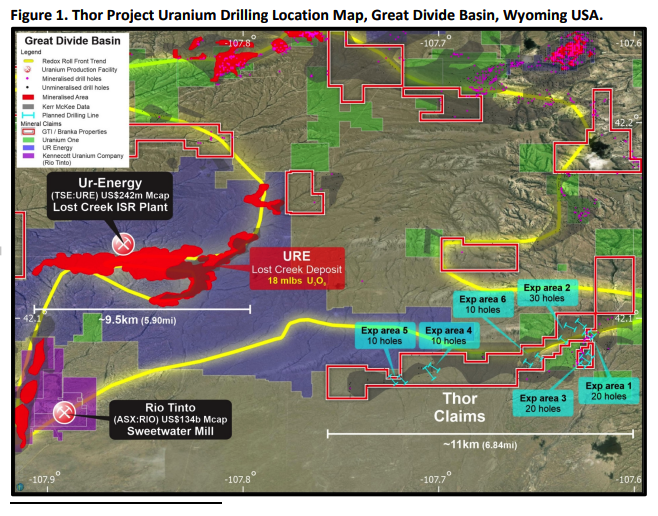
GTR’s neighbour is reported to have a remaining 13Mlbs of uranium at an average grade of 0.048% uranium using a cut-off grade thickness measure of 0.2.
The “cut-off” refers to what is considered economic and what isn't.
When looking at gold deposits the cut-off reference point is usually a grams per tonne figure which means that the grade of a drill result is the be-all and end-all of a drilling program.
In the context of an ISR project, the cut-off measure is “Grade Thickness” (GT for short).
This means when we look at a drill result for an ISR uranium project like GTR’s, we should be focussed mostly on the overall Grade Thickness result.
So, not only have GTR’s grades been above its neighbour's projects, most importantly the GT has been significantly higher than the economic cut-off of 0.2.
GTR’s GT average 0.99 across the first 10-holes - four times more than the economic cut off of 0.2.
In addition, the two best results returned a Grade Thickness of 1.92 and 1.74 - almost 10x the economic cut-off of 0.2 GT.
If we continue to see results like the ones received to date then the likelihood of a confirmed economic resource increases.
Of course, it is still relatively early in the drilling program with the first 10 holes measuring ~1,530m out of a targeted 15,000m - so ultimately the results from the remaining drill holes will determine if there is an economic resource below.
Early days and positive signs, but ultimately we need to see how the next 90 holes go.
What’s next for GTR?
We want to see GTR replicate the success of the first 10 holes and continue to deliver an average Grade Thickness result above the targeted 0.2 figure.
Beyond the current drilling, ideally want to see GTR do one of two things:
- Announce an initial maiden ISR uranium resource, or;
- put together an achievable exploration target which will form the basis for future Exploration programs.
Deep dive into Grades and Thickness for Uranium Deposits
As we mentioned above, Grade Thickness is the yardstick by which all ISR uranium deposits are measured.
The Grade Thickness is measured by combining the grade of a drill intercept by the thickness.
When evaluating ISR drill results, we need to think in terms of a combination of the two, and never one without the other.
GT = Grade x thickness
With ISR uranium exploration drilling, ideally we want to see thick intercepts with low grades.
Once grade and thickness are multiplied, we get the GT figure, and if the GT is higher than the cut-off, the project is considered economic.
The cut-off sets a standard from which results above are considered economic and those below are considered uneconomic.
The typical economic cutoff for a sandstone-hosted ISR uranium project in Wyoming’s Great Divide Basin is a GT measure of 0.2.
For reference, the operating UR-Energy owned Lost-creek project next to GTR’s project has its resource measured using a cut-off Grade Thickness measure of 0.2.
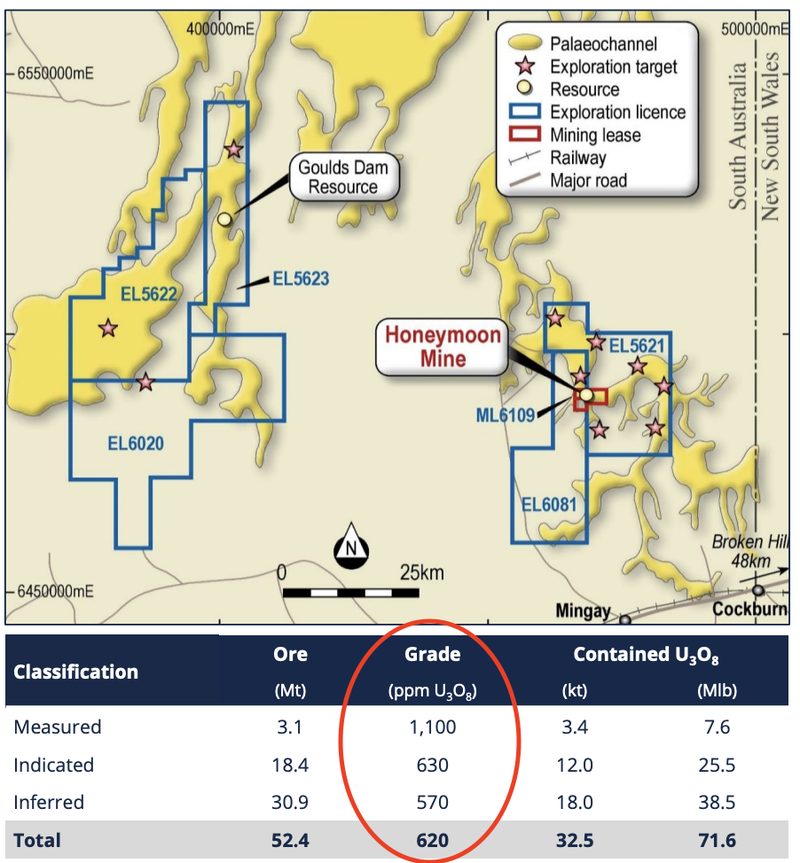
Here is another example of an ISR uranium project (ASX Listed Boss Energy’s Honeymoon project) Which has a 0.06% uranium grade and is considered an economic discovery.
Below is an excerpt from some research done by CSA global that highlights how low grades are favorable and that we are looking for is a high “Grade Thickness measure” for an In-Situ-Recovery project to be considered favorable.
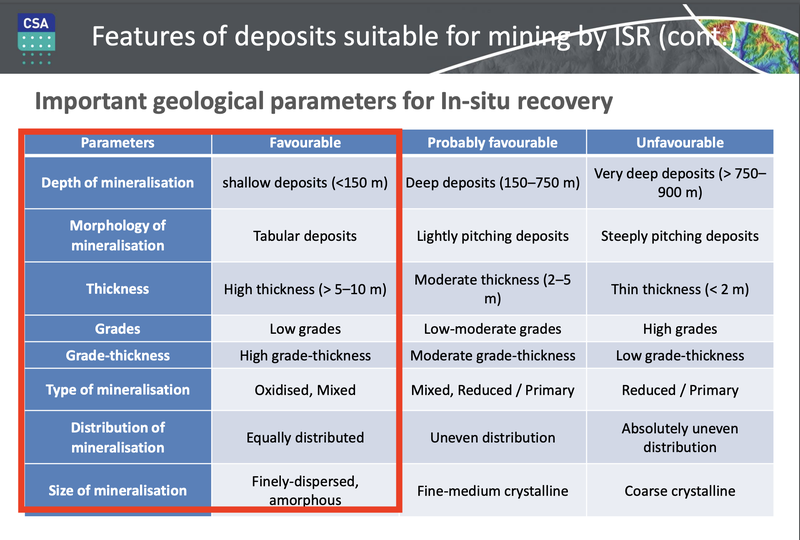
ISR deposits work in this unconventional way where what looks like low grade mineralisation can actually be an indicator of an economic discovery.
This is why when assessing GTR’s results, Grade Thickness is the key parameter we need to focus on.
Why is ISR Uranium interesting?
A large part of the reason we rely more on Grade Thickness and less on grades comes when assessing drill results like GTR’s comes from the cost advantages ISR projects have versus conventional mining methods.
Before going into the advantages of ISR mining it’s important to understand exactly how it works.
ISR mining, also called Insitu Leach (ISL) or Solution Mining, is the lowest cost uranium mining method and has lower environmental impact than hard rock mining.
If you recall from above. ISR mining is essentially the process of pumping liquid into an orebody to dissolve the mineralised deposit and then using what is called the “leach” (recovery) process to pump the dissolved solution back to surface through a recovery well for processing.
To learn more about In Situ Recovery mining methods for uranium - read our detailed breakdown here.
On the image below, the left hand side is the conventional Ranger Uranium project in the NT and on the right hand side we have the Honeymoon ISR uranium project.
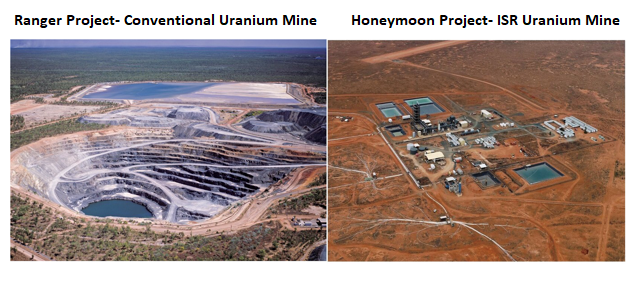
The visual differences between the two types of mining are enough to understand where these cost advantages come from.
Keep in mind we haven't even included an image of the processing facilities associated with the Ranger Project.
ISR mining is generally a lot cheaper when compared with conventional mining methods because of the low capital expenditures required to construct and the lower operating costs once they are operational.
Think about how the two projects above were put into production...
With the Ranger Project, they had to strip back tonnes of worthless non-mineralised ore just to get to the uranium ore body. Just like any open-cut, underground mine, this isn't cheap.
As for the ISR uranium project, it is just about building out processing facilities and tying in wells that pump the mineralised solution in for processing.
IRS is a lot less capital intensive to construct and also self-sufficient once it is operational.
Another major positive is the lower remediation costs once an ISR project is at the end of its useful life.
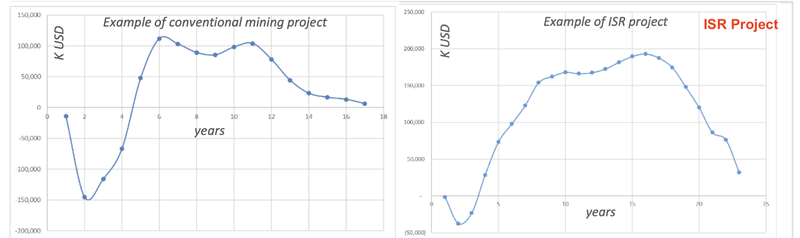
Referring back to the same CSA research we mentioned earlier in the article, the project return curves for ISR projects are much more attractive and analysis of the uranium industry as a whole shows that ISR mining produces the cheapest source of uranium.
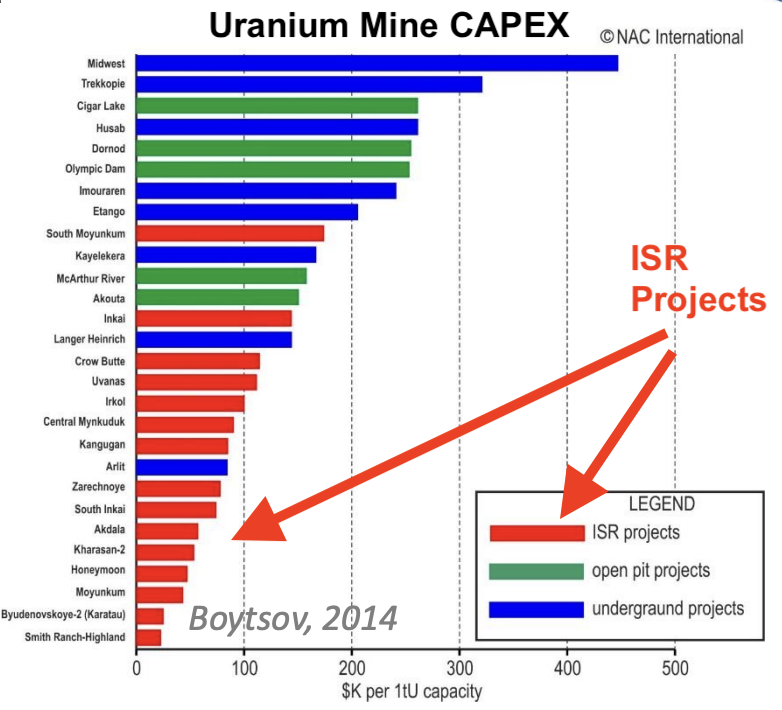
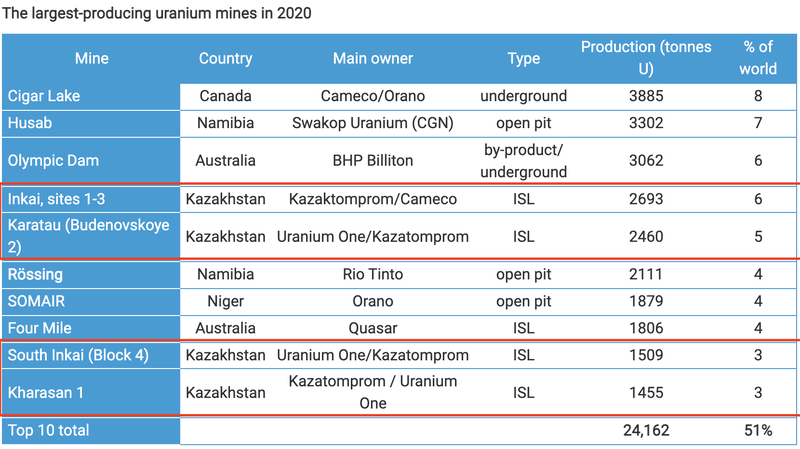
It is no wonder that all of the biggest uranium mines in Kazakhstan are mined using ISR methods.
Kazakhstan accounts for ~41% of Global Uranium supply and are the lowest-cost producers in the world.
From the image above, ISR (In-Situ-Recovery) is the same as ISL (In-Situ-Leaching). Leaching is just another term that is used for recovery.
Without all of this context, it can be hard to see what GTR is doing and what the drill results mean.
ISR is the cheapest way of producing uranium so if GTR can make a discovery they will have a resource that is valuable not only in a uranium bull market, but could also be economically viable when the uranium price is depressed.
As with all mining companies, the ones with a cost advantage over their competition are the ones you want to own. These companies give investors the highest leverage to bull markets and resilience in bear markets.
What are the risks?
GTR is currently at an important juncture in the resource delineation process.
There is a significant risk the drilling programs completed with no significant mineralisation and a resource is not able to be announced. There is also a chance the project is abandoned because the results are much worse than expected.
At this point in time investors need to manage their risk appropriately given the outcomes of drilling can often be binary.
What’s next for GTR and what do we want to see?
First we want to see the results from the remaining ~90 drill holes - GTR is expecting to finish these by early January.
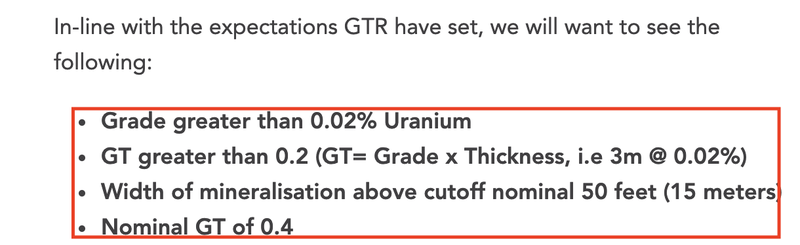
The expectations set from our last note still stand so we will be looking for the following:
- Grade greater than 0.02% Uranium
- GT greater than 0.2 (GT = Grade x Thickness)
Beyond the current drilling, we want to see GTR at the very least announce an exploration target for the project.
A great result would be if they can put out a maiden resource estimate for the project.
If a resource is announced we think GTR could be re-rated from a prospective explorer to one with an established uranium resource.
Wyoming Projects: Uranium, U.S.A
✅ Project Acquisition Announced
✅ Project Acquisition Complete
✅ Drilling Permits Secured (Q4 2021)
🔄 Initial Drilling (Thor, Q4 2021)
🔄 Drilling Results (Thor, H1 2022)
🔲 Initial Drilling (Odin & Loki, H1 2022)
GTR Investment Milestones
Read our investment memo on GTR here.
✅ Initial Investment: @ 1.2¢
✅ Increase Investment: @ 3.3¢
✅ Increase Investment: @ 1.5¢
🔲 Price increases 500% from initial entry
🔲 Price increases 1000% from initial entry
🔲 Price increases 2000% from initial entry
✅ 12 Month Capital Gain Discount
🔲 Free Carry
🔲 Take Some Profit
🔲 Hold remaining Position for next 2+ years
Disclosure: The authors of this article and owners of Next Investors, S3 Consortium Pty Ltd, and associated entities, own 20,232,084 GTR shares and 746,615 GTR options at the time of publication. S3 Consortium Pty Ltd has been engaged by GTR to share our commentary on the progress of our investment in GTR over time.
General Information Only
This material has been prepared by StocksDigital. StocksDigital is an authorised representative (CAR 000433913) of 62 Consulting Pty Limited (ABN 88 664 809 303) (AFSL 548573).
This material is general advice only and is not an offer for the purchase or sale of any financial product or service. The material is not intended to provide you with personal financial or tax advice and does not take into account your personal objectives, financial situation or needs. Although we believe that the material is correct, no warranty of accuracy, reliability or completeness is given, except for liability under statute which cannot be excluded. Please note that past performance may not be indicative of future performance and that no guarantee of performance, the return of capital or a particular rate of return is given by 62C, StocksDigital, any of their related body corporates or any other person. To the maximum extent possible, 62C, StocksDigital, their related body corporates or any other person do not accept any liability for any statement in this material.
Conflicts of Interest Notice
S3 and its associated entities may hold investments in companies featured in its articles, including through being paid in the securities of the companies we provide commentary on. We disclose the securities held in relation to a particular company that we provide commentary on. Refer to our Disclosure Policy for information on our self-imposed trading blackouts, hold conditions and de-risking (sell conditions) which seek to mitigate against any potential conflicts of interest.
Publication Notice and Disclaimer
The information contained in this article is current as at the publication date. At the time of publishing, the information contained in this article is based on sources which are available in the public domain that we consider to be reliable, and our own analysis of those sources. The views of the author may not reflect the views of the AFSL holder. Any decision by you to purchase securities in the companies featured in this article should be done so after you have sought your own independent professional advice regarding this information and made your own inquiries as to the validity of any information in this article.
Any forward-looking statements contained in this article are not guarantees or predictions of future performance, and involve known and unknown risks, uncertainties and other factors, many of which are beyond our control, and which may cause actual results or performance of companies featured to differ materially from those expressed in the statements contained in this article. S3 cannot and does not give any assurance that the results or performance expressed or implied by any forward-looking statements contained in this article will actually occur and readers are cautioned not to put undue reliance on forward-looking statements.
This article may include references to our past investing performance. Past performance is not a reliable indicator of our future investing performance.