
Brazil Lithium: LRS reveals $3.6BN Net Present Value for $400M CAPEX
Published 28-SEP-2023 10:00 A.M.
|
13 minute read
Disclosure: S3 Consortium Pty Ltd (The Company) and Associated Entities own 2,129,500 LRS shares at the time of publishing this article. The Company has been engaged by LRS to share our commentary on the progress of our Investment in LRS over time.
Our Investment Latin Resources (ASX: LRS) has just released a first look at the economics of its lithium project in Brazil.
And the numbers have far exceeded our expectations and “best case” internal, rough estimates (shared later in this note).
$684M capped LRS is unashamedly copying the playbook of its regional neighbour $5.5BN capped Sigma Lithium.
Sigma became Brazil’s first ever lithium producer back in April after discovering, growing and now mining a lithium resource - quickly to take advantage of the current lithium boom.
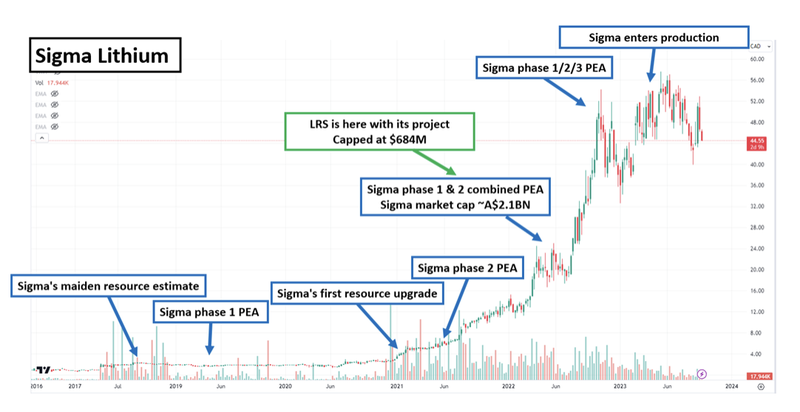
Over the last three years, Sigma’s share price has gone from (CAD) ~$2 to ~$46 - a return of over 2,300%.
The preliminary economic numbers published by LRS today stack up very nicely against what Sigma Lithium released back in May 2022 before the share price ran from ~CAD$16 to a high of ~CAD$46per share.
(remember though that just because Sigma performed this way is not an indicator LRS will do necessarily do the same)
Key details of what LRS revealed today:
$3.6BN Net Present Value (NPV)
$12BN life of mine revenue.
Turns out this can all be built for phase 1 CAPEX of ~A$400M with the rest of the funding being paid out of cashflows from production.
And this money gets earned back in just 7 months through mine revenue (“payback period”).
LRS expects its first production in 2026, just as the lithium price is projected for another run.
We are genuinely surprised at how good these numbers are, which are a lot better than our internal estimates (we will share our internal workings below).
LRS has also only used 26Mt of its 45Mt resources for this estimate (due to ASX rules for only using a certain % of inferred and indicated resources for early economic estimates).
So these numbers are going to grow.
LRS also currently has 11 drill rigs on site to expand the resource, so its resource is going to grow even more.
Early economic studies like the one released by LRS today give investors a first look at how much a project will cost to build and the profits it will deliver.
It is often the trigger for larger, more sophisticated funds to enter a stock (they need to see numbers, not narrative)
For example, many will remember when Vulcan released its first economic study back on Jan 15th 2021...
The share price ran from $6 to touch a high of $14 on Vulcan’s $3.5BN NPV and €1.74BN CAPEX - this was the biggest one week share price jump in Vulcan’s history.
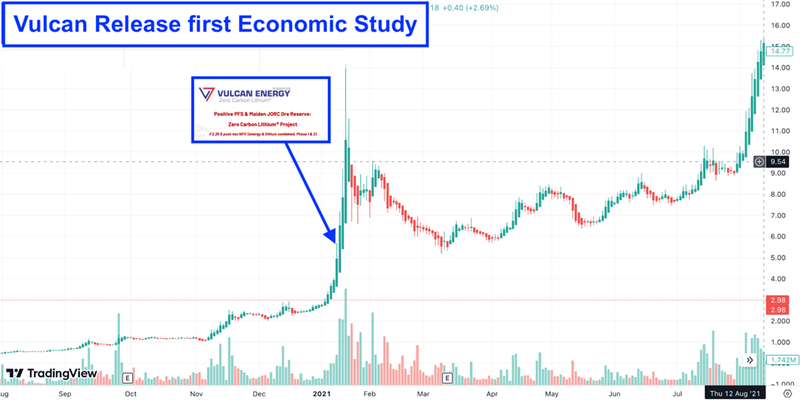
Past performance is not an indicator of future performance. The market conditions at the time that Vulcan’s PFS were released were very different from today, and there is no likelihood that LRS share price can react the same way in this short amount of time.
But the LRS story is all about copying the $5.5Bn Sigma Lithium playbook
The LRS story is all about copying the successful playbook of its regional neighbour Sigma Lithium.
Sigma put its project into production in April this year and is forecast to be the worlds 8th largest producer by 2025.
LRS never shied away from the fact that its strategy is to emulate Sigma in every way possible.
LRS’s project is in the same region as Sigma, LRS have a close relationship with Sigma’s Management, they share information, and LRS is actively engaging Sigma’s consultants, service providers and bankers.
After LRS’s discovery in March 2022, LRS was even given the nickname Sigma 2.0.
Sigma’s CEO Ana Cabral-Gardner said “it’s an honour... for LRS to be called Sigma 2.0”.
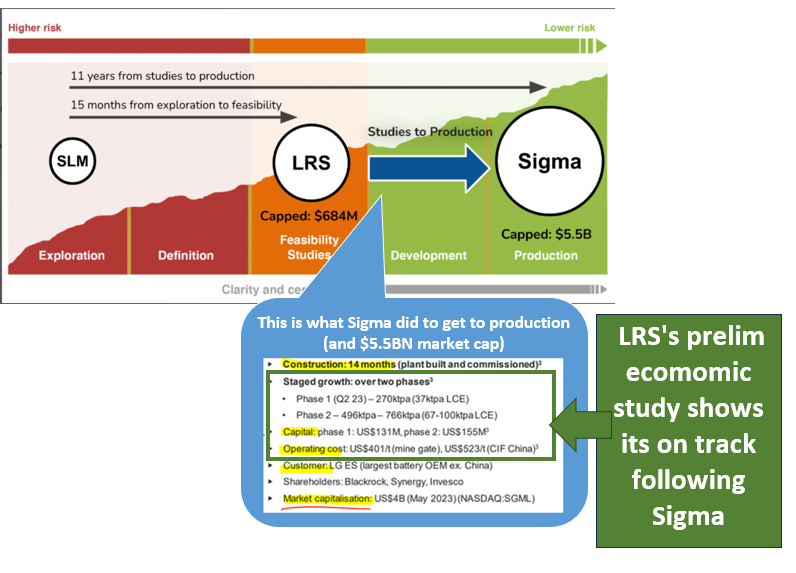
So, in summary, we have been following $684M LRS and their journey to become a “carbon-copy” of $5.5BN Sigma lithium.
LRS will be following the exact set of steps Sigma followed to move from a ~$2BN market cap at the feasibility study stage to the $5.5BN market cap it has now in the production stage.
Today, LRS ticked off a key step in releasing an economic study that stacks up against Sigma’s early study:
Today’s PEA has delivered way above what we were hoping to see.
Here is our internal analyst’s rough, “back of the napkin” best case numbers that we had been hoping for LRS, most of the assumptions we made were based off Sigma’s early economic studies:
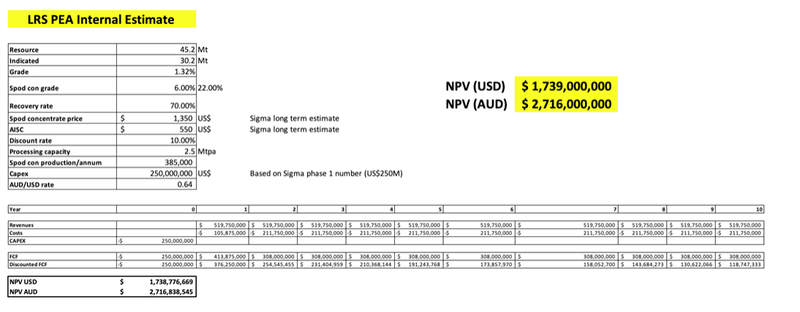
LRS exceeded our hopes for best-case NPV by almost A$1BN and beat our estimates in almost every department like production profile and the percentage of its overall resource used.
Today, we will do a deep dive into all of the following:
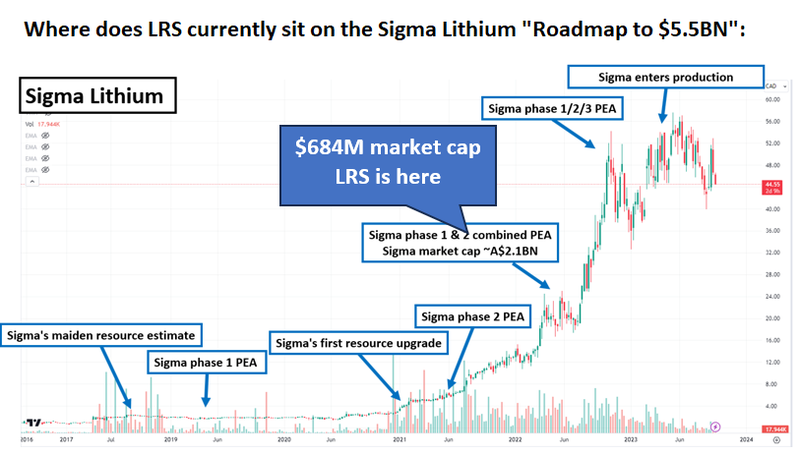
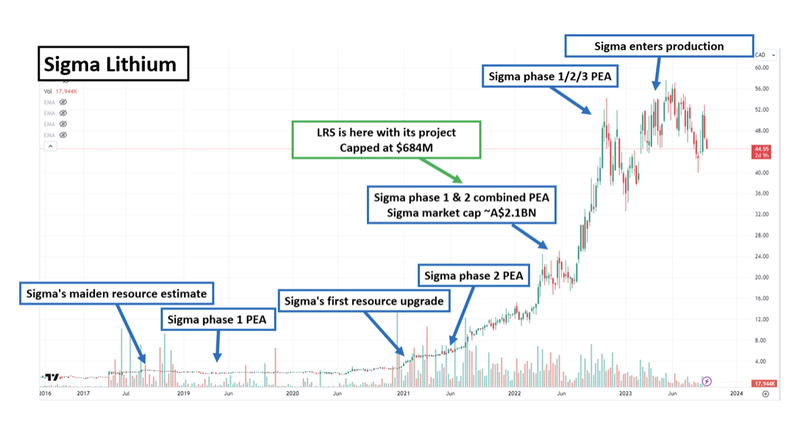
- Where in the Sigma playbook is LRS right now - We think LRS is where Sigma was in May 2022 when it was capped at ~A$2.1BN.
- How LRS can make its project economics even better - Drilling with 11 rigs to increase its JORC resource right now.
- Our take on LRS’s PEA compared with Sigma’s project - Sigma put out a combined PEA for phases 1 and 2 of its project in May 2022, we look at how LRS’s project stacks up against Sigma’s.
- What’s next for LRS - JORC resource upgrades, Definitive Feasibility Study (DFS), potential offtake agreements? And maybe surprise strategic partnership announcement?
A deeper dive into the LRS Project
LRS’s project sits in the state of Minas Gerais next to $5.5BN Sigma Lithium.
Sigma is Brazil’s biggest lithium company by market cap and is forecast to be the eighth largest lithium producer on the planet by 2025.
Over the last three years, Sigma’s share price has gone from ~$2CAD to $46CAD - a return of over 2,300%.
Sigma got to where it is by drilling out and upgrading its resource several times, running feasibility studies and eventually putting its project into production.
LRS, from day one, has been looking to emulate the success of Sigma.
After its discovery in March 2022, LRS was given the nickname Sigma 2.0 - even Sigma’s CEO Ana Cabral-Gardner said “it’s an honour... for LRS to be called Sigma 2.0”.
Over the last ~18 months LRS has been following Sigma’s development playbook.
LRS made its lithium discovery, completed several rounds of drilling, raised ~$70M in capital, and put out two resource announcements over the last 18 months.
This is some of the quickest development we have seen from any small cap junior we have Invested in.
Now LRS has put out its first economic study showing:
- A$3.6BN after-tax NPV
- 132% post-tax Internal Rate of Return.
- Phase 1 CAPEX of ~A$400M - phase 2 to be funded from cashflows.
- 7 Month payback period.
At its last close price LRS’s market cap was just ~$684M - a fraction of its projects NPV and a fraction of Sigma’s.
LRS now finds itself in a similar position to where Sigma was back in 2021 when it released its phase 2 preliminary economic assessment, after which Sigma was capped at ~$2.1BN.
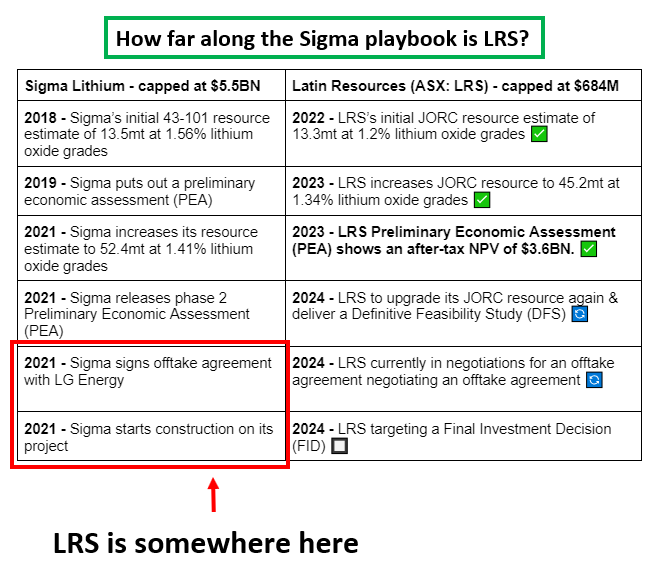
What came after Sigma’s phase 2 PEA was an offtake agreement with LG Energy and another resource upgrade, taking Sigma’s resources to ~106.8mt in 2022.
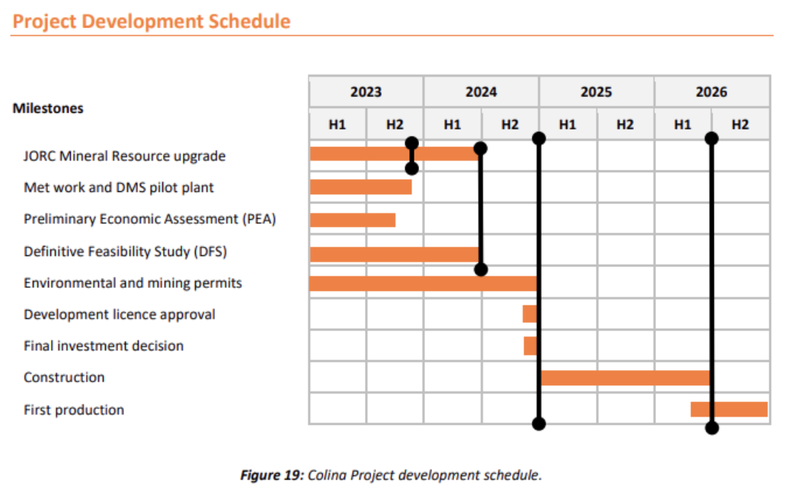
LRS is working toward almost identical milestones:
- A JORC resource upgrade - LRS is currently drilling out its project with 11 rigs and is looking to upgrade its JORC resource within the next 6-9 months.
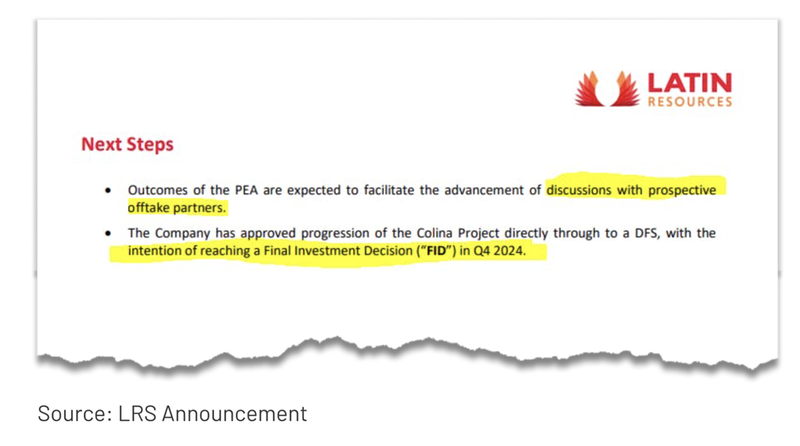
- In discussions with offtake partners - LRS has mentioned offtake discussions in several presentations AND in today’s announcement. An announcement with an offtake partner would mean it ticks almost every step Sigma did before it put its project into development.
Sigma’s offtake with LG Energy was in 2021, and almost immediately after, Sigma made an Investment decision and started constructing its project.
LRS, again, almost identically to Sigma, is aiming for an offtake and a Final Investment Decision (FID) in 2024.
How LRS became Sigma 2.0:
To understand how LRS became Sigma 2.0 it's best to look at how Sigma became what it is today.
In June 2018, Sigma had a market cap of ~CAD$134M (CAD$2 per share).
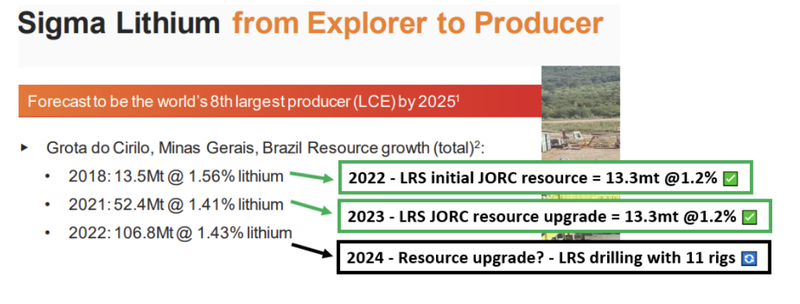
Sigma’s first drill program led to its first foreign resource estimate in 2018 - A 13mt resource with lithium grades of ~1.56%.
Sigma’s resource came just before the lithium market tanked, and its preliminary economic assessment for the project came in 2019 when the lithium industry was on its knees.
Over the next 2 years the company was effectively in “quiet execution mode” (at the exact moment when LRS entered the Brazilian lithium space).
Then again, as the lithium price picked up, Sigma put out an upgraded resource estimate, an updated phase 2 PEA, signed offtake agreements with LG and then eventually put its project into production in 2023.
Taking away the two-year lithium bear market Sigma went from its first resource estimate to production in ~4 years.
LRS is looking to do the exact same thing...
LRS made its discovery in March 2022 and almost immediately had a fleet of rigs drilling around the clock - we went back and checked, and the rigs literally haven't stopped drilling since then.
In that time, LRS has put out two resource estimates, and now it's first economic assessment of the project - getting to where Sigma was in mid-2021.
It's relatively easy to see where LRS is going with its project, following in the footsteps of Sigma.
LRS’s recent 15-year anniversary video summarises the project origins perfectly:
The difference between Sigma and LRS now is that Sigma is ~12-18 months ahead and in production.
Right now, Sigma is capped at $5.5BN, and LRS capped at $684M - we think that as LRS gets its project closer to development, that valuation gap should narrow.
How does LRS’s PEA stack up against Sigma’s phase 2 study?
The obvious disclaimer for this part of our note is that not all feasibility studies are equal.
LRS’s study is a Preliminary Economic Assessment (PEA) whereas Sigma’s was a technical study.
🎓To learn more about feasibility studies read: Feasibility Studies Explained: Evaluating Project Viability.
We think the best comparison to LRS’s PEA is Sigma’s phase 1 & 2 technical study, which was released in May 2022 (read it here).
One thing that jumped out to us was just how conservative LRS has been with the inputs to its study.
Here is our take on how the studies compare:
Net Present Value (NPV)
Sigma showed an after-tax Net Present Value (NPV) for its phase 1 & 2 development of US$5.1BN.
How does LRS compare?
LRS’s project showed an after-tax NPV of $3.6BN (US$2.5BN).
Production profile
Sigma’s study was based on the production of 531,000 tonnes of spodumene concentrate.
How does LRS compare?
LRS’s PEA is based on ~405,000tpa of 5.5% spodumene concentrate and ~123,000tpa of 3% spodumene concentrate.
LRS’s production profile is based on mining just 26.39mt of its total ~45.2mt JORC resource.
Given LRS is drilling to upgrade its resources, we think LRS has left a lot of room to up its production profile AND increase its mine life.
Lithium price
In that study, Sigma was plugging in a lithium price of US$2,247 per tonne of spodumene concentrate.
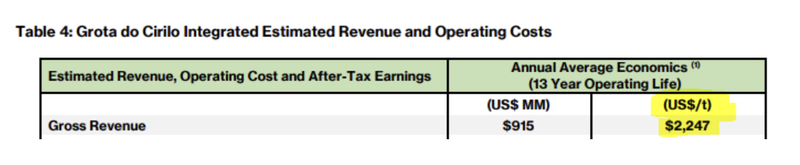
(Source)
How does LRS compare?
LRS plugged in an average lithium sale price of US$1,699 per tonne, which is ~32% lower than Sigma’s number.
Interestingly the sensitivity analysis in the PEA shows that if LRS were to increase the lithium price by ~32% then the NPV for its project would be closer to US$4BN.
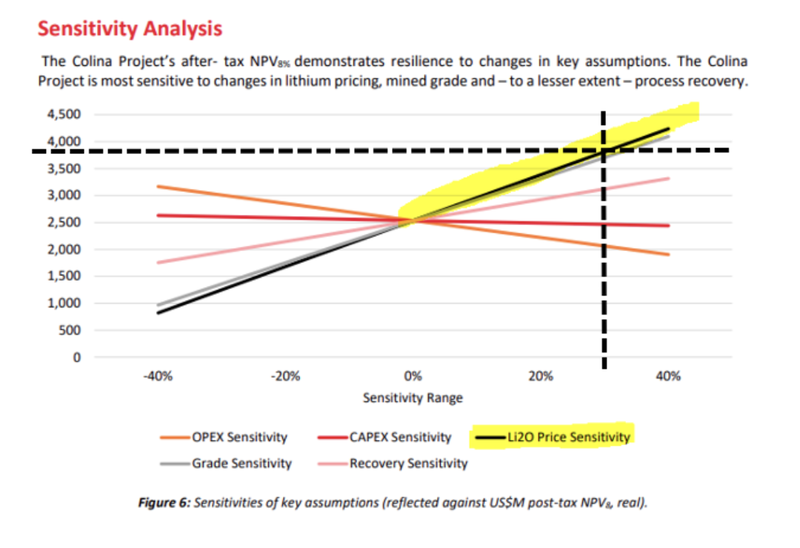
(Source)
Mine life
Sigma’s study was based on a mine life of 13 years.
How does LRS compare?
LRS’s PEA is based on an initial mine life of ~11 years.
Again, given LRS is drilling its resource right now and is only using a small portion of its existing JORC resource for the study, we think there is scope to increase the mine life and the project economics in turn.
CAPEX
Sigma’s study included ~US$200M in CAPEX for phases 1 and 2 combined.
Sigma also had an operating life of mine CAPEX of ~US$170.2M.
How does LRS compare?
LRS is using a relatively similar number when all costs are considered, albeit with ~US$40M less CAPEX.
LRS’s total CAPEX for both phases 1 and 2 is ~US$330M, including contingency costs.
Cost of production
Sigma’s study showed an all-in sustaining cost (AISC) of production of US$455 per tonne.
How does LRS compare?
Again, LRS has gone for a more conservative number here plugging in an AISC of US$536 per tonne.
We think that in LRS’s next feasibility study an expansion to the project will mean economies of scale and a potential reduction in the AISC numbers for the project.
Market cap after announcing the study
At the time, Sigma had a market cap of ~CAD$1.8BN and a share price of ~CAD$18.30.
How does LRS compare?
At its last close price (26 cents per share) LRS had a market cap of just $684M.
LRS is capped ~5.2x less than its project NPV (based on just phases 1 and 2) AND is capped ~8x less than Sigma’s market cap right now.
LRS is also a third of the valuation Sigma had when it put out its phase 1 & 2 technical study back in May 2022.
Sigma has a market cap of ~A$5.5BN and its project is in the production ramp up phase right now.
We are hoping LRS continues to execute on the Sigma playbook and re-rates to a valuation in line with its regional peer.
The Sigma playbook forms the basis for our LRS Big Bet which is as follows:
Our LRS Big Bet:
“LRS increases the scale of its lithium discovery to the level of its multi billion dollar regional peer - Sigma Lithium. With this we would expect the market to value LRS similarly.”
NOTE: our “Big Bet” is what we HOPE the ultimate success scenario looks like for this particular Investment over the long term (3+ years). There is a lot of work to be done, many risks involved - just some of which we list in our LRS Investment memo. Success will require a significant amount of luck. There is no guarantee that our Big Bet will ever come true.
What’s next for LRS?
JORC resource upgrade 🔄
LRS has 11 drill rigs on site drilling around the clock.
We expect to see drill results announced through to the end of the year AND a JORC resource upgrade sometime before the end of H1 2024.
Met work and pilot plant 🔄
Met work and pilot plant optimisation work is something that is done in the background while the project is moved towards development.
We expect to see LRS work on this in the background all the way through to when a Final Investment Decision is made.
It's hard to predict when LRS will announce any updates on this front but we will be sure to look out for them when they drop.
Ultimately, any improvements in the flow sheet & increases in recovery rates will flow through to improved project economics.
Definitive Feasibility Study (DFS) 🔄
LRS is targeting a completed Definitive Feasibility Study before June 2024.
We expect to see this after LRS upgrades its JORC resource.
[Unexpected surprises] Offtake agreements?
The most unexpected newsflow item between now and LRS’s upgraded JORC/DFS will be an offtake agreement(s).
LRS hinted at negotiations being ongoing with potential offtake partners so there is a chance something will happen at any point between now and the end of 2024.
Depending on the deal LRS strikes we think this could be an unexpected surprise catalyst for the market.
[Unexpected surprises] Funding announcements?
LRS had $46M cash in the bank at 30 June 2023 and a market cap of ~$684M.
Being in that position gives LRS a good starting point to secure the CAPEX funding it needs to get phase 1 of its project developed.
LRS confirmed in today’s announcement that the overall funding mix for the project would be a “mix of debt, equity, and offtake arrangements”.
We also noticed the following section in today’s announcement where LRS confirms it has already had multiple in-bound requests for funding solutions for its project.
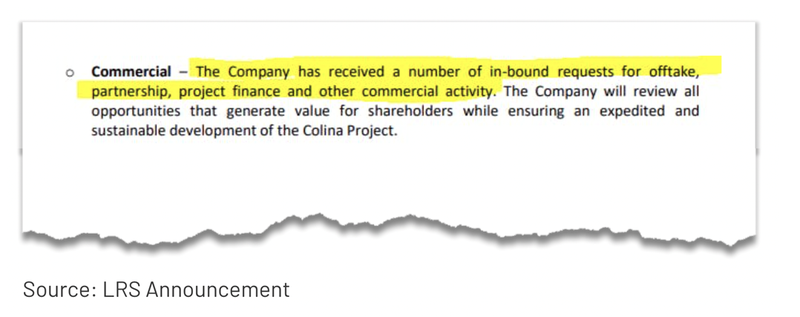
(Source)
We think that an unexpected announcement showing LRS progress with funding
(Source)
Our LRS Investment Memo:
Click here for our LRS Investment Memo, where you can find the following:
- Key objectives we want to see LRS achieve
- Why we are Invested in LRS
- What the key risks to our Investment thesis are
- Our Investment plan
General Information Only
This material has been prepared by StocksDigital. StocksDigital is an authorised representative (CAR 000433913) of 62 Consulting Pty Limited (ABN 88 664 809 303) (AFSL 548573).
This material is general advice only and is not an offer for the purchase or sale of any financial product or service. The material is not intended to provide you with personal financial or tax advice and does not take into account your personal objectives, financial situation or needs. Although we believe that the material is correct, no warranty of accuracy, reliability or completeness is given, except for liability under statute which cannot be excluded. Please note that past performance may not be indicative of future performance and that no guarantee of performance, the return of capital or a particular rate of return is given by 62C, StocksDigital, any of their related body corporates or any other person. To the maximum extent possible, 62C, StocksDigital, their related body corporates or any other person do not accept any liability for any statement in this material.
Conflicts of Interest Notice
S3 and its associated entities may hold investments in companies featured in its articles, including through being paid in the securities of the companies we provide commentary on. We disclose the securities held in relation to a particular company that we provide commentary on. Refer to our Disclosure Policy for information on our self-imposed trading blackouts, hold conditions and de-risking (sell conditions) which seek to mitigate against any potential conflicts of interest.
Publication Notice and Disclaimer
The information contained in this article is current as at the publication date. At the time of publishing, the information contained in this article is based on sources which are available in the public domain that we consider to be reliable, and our own analysis of those sources. The views of the author may not reflect the views of the AFSL holder. Any decision by you to purchase securities in the companies featured in this article should be done so after you have sought your own independent professional advice regarding this information and made your own inquiries as to the validity of any information in this article.
Any forward-looking statements contained in this article are not guarantees or predictions of future performance, and involve known and unknown risks, uncertainties and other factors, many of which are beyond our control, and which may cause actual results or performance of companies featured to differ materially from those expressed in the statements contained in this article. S3 cannot and does not give any assurance that the results or performance expressed or implied by any forward-looking statements contained in this article will actually occur and readers are cautioned not to put undue reliance on forward-looking statements.
This article may include references to our past investing performance. Past performance is not a reliable indicator of our future investing performance.